FRUITNIR-GUI: Helping Users Improve Model Performance
Scott Trimble
June 3, 2021 at 10:12 pm | Updated April 11, 2022 at 6:44 am | 7 min read
As the use of precision technology increases in food production, it is necessary to ensure that the devices are adapted to the entire range of environmental conditions under which a single fruit is grown. A new, free software makes it easy for people to improve the NIRS models used to analyze near-Infrared spectroscopy data that is widely used for measuring fruit quality parameters in the supply chain.
Improving Chemometric Models
Near-Infrared (NIR) spectroscopy uses the propensity of this light band to react with the vibrations of bonds between hydrogen and oxygen, nitrogen, and carbon. NIR spectroscopy is now the main non-destructive means to identify and quantify the internal chemical properties of fruits.
Portable NIR spectroscopy (NIRS) devices are widely used to check fruit quality in the entire supply chain. Dry matter (DM) and soluble sugar contents (SSC) are used to decide harvest time, sort and grade fruits, and process fresh produce.
Subscribe to receive our monthly round-up of articles.
A NIRS device has to be robust enough to make accurate predictions of the fruit quality parameters, regardless of the location, climate, or agricultural practices of farms where the fruits are grown. The chemometric models, which analyze the complex spectral data collected by the device, are the crux. However, people have noticed that models created for a particular site and season are not always equally effective in predicting parameters for fruits from different regions and seasons. Fortunately, correcting for these variables is possible.
The chemometric models could be improved by changing variable selection or through batch effect correction by transfer component analysis (TCA) and dynamic orthogonal projection (DOP). However, these procedures are difficult and rarely possible for a non-specialist to use. So, although there are many scientific toolkits to improve models, the challenging usage often precludes implementation.
Hence, a multinational European team of scientists from various disciplines, like food science, physics, chemistry, and chemometrics, came together to try and create a graphic, user-friendly software to improve NIRS models.
The Software – FRUITNIR-GUI
The new free software developed by the multidisciplinary team of scientists is called FRUITNIR-GUI and was developed by using MATLAB, the application builder. Users who want to use the software can download it free here.
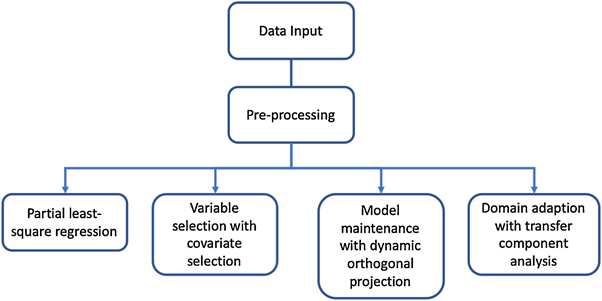
Figure. 1: “A summary of the methods available in Fruitnir-gui,” Mishra et al, 2021. (Image credits: Postharvest Biology and Technology, 175, 111414. doi:10.1016/j.postharvbio.2020.111414)
Figure 1 shows the different steps involved in the use of the new toolbox. It has options for loading data and three levels of pre-processing through different methods. People can choose from three options to improve the chemometric model:
- Covariate selection
- Dynamic orthogonal projections (DOP) for model maintenance
- Transfer component analysis (TCA) for domain adaption
Models are compared using the root mean squared error of prediction (RMSEP) and coefficient of determination of prediction (R2P).
The scientists demonstrate the use of the software with a case study, where the chemometric model to predict DM of apples was improved to fit harvests from a different season.
Apple Case-Study
To demonstrate the new software, the scientists used a NIRS data set for DM prediction that had been collected in post-harvest apples for two seasons.
Scientists Teh and Evans from Washington State University supplied the NIRS data from a previous study. Teh et al. had sampled 2,252 fruits from 58 accessions from three orchards. The accessions included 34 apple selections from a breeding program and five commercial cultivars: Cripps Pink, Gala, Fuji, Honeycrisp, and Golden Delicious. Teh et al. cool stored the fruits at 2°C for two months. Then, the apples were kept at room temperature of 25°C for a week before data collection. Non-destructive NIRS measurements were made from five randomly selected fruits.
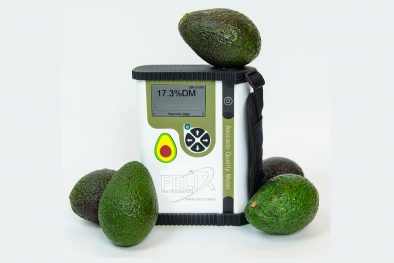
The instrument used by Teh et al. was the F-750 Produce Quality Meter, manufactured by Felix Instruments-Applied Food Science. This device is used commercially to measure the quality parameters of a wide range of fruits worldwide. The handheld, portable F-750 can measure DM, SSC, internal and external color using Visible and NIR spectral data. Individual measurements are completed in seconds. The device also includes model building software (recently upgraded to include artificial neural networking options) to create unlimited models to extend the use of the device for new cultivars or locations.
The scientists also estimated the DM of the five apples through the use of a destructive method that involves dehydrating a core from the apples in a food dehydrator.
To demonstrate the software in the current study, the model was built using the 2015 data as the training set and was tested on the 2016 data. Around 20% of the 2016 data was used for optimization, and 80%, selected randomly, was used as the external test data set.
Using the Software
The scientists loaded data from the previous study and performed the following steps: data input, pre-processing, analyzing the data, calibration, and validation of the model. These important steps in chemometrics are all covered by the new software..
Data Input: The FRUITNIR-GUI allows people to upload two data sets in csv, .xlsx, and .mat formats. Once the scientists loaded the data, they could pre-process it. See Figure 2 for the steps they followed during the use of the software.
Pre-processing: Multivariate spectral data can be affected by the physical and chemical properties of the fruit and have outliers. These outliers have to be removed. Then, the data have to be normalized before they can be analyzed. The multi-disciplinary team of scientists first pre-processed the NIRS data acquired from the previous study using three common methods in multiple steps, with FRUITNIR-GUI. These methods were as follows:
- Smoothing
- Scatter correction and
- Normalization or differentiation
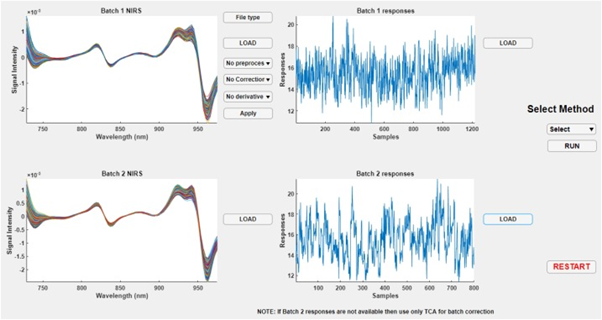
Figure. 2: “GUI for loading and pre-processing datasets. Two different batches can be loaded through the same interface. Prior to loading the second batch, batch 1 should be pre-processed with the desired pre-processing. The same pre-processing will automatically be applied to the second batch data when it is loaded,” Mishra et al, 2021. (Image credits: Postharvest Biology and Technology, 175, 111414. doi:10.1016/j.postharvbio.2020.111414).
Analysis by the model: The partial least square regression (PLS) model, which is commonly used in chemometrics, is used in the software, FRUITNIR-GUI, for analyzing the multivariate NIRS spectral data.
The preceding steps are common to all chemometric model creations. The new software now provides three additional options to improve the models for the second data set: covariate selection, model maintenance, and domain adaption.
Covariate selection (CovSel): The variables that are analyzed by the improved model have to be selected. The software uses an in-house code for this purpose. It relies on covariance selection, a common method used to decide which of the predictor variables is important. The variables with the most covariance or strongest relation with the response factors are chosen as predictors. One method of selection is choosing the set of variables that produces the minimum root mean square error during cross-validation.
Using the new variable the final calibration model for the second data is created.
Model maintenance: Dynamic orthogonal projection (DOP) is used for the model maintenance method and cross-validation of the model. The data used for calibration is corrected using new measurements made in different environmental and management conditions. An in-house function performs this step. Then, using the corrected data, a second PLS model is built.
Domain adaption: When NIRS measurements are made using different devices, or at different temperatures or during different seasons, the covariance matrices between predictor and response variables will be different. Transfer component analysis tries to minimize the difference between two different data sets while keeping their respective covariance. A common space is found by mapping the two data sets together, and this space is used in PLS modeling.
Try All Options
As expected, the scientists found that testing the first model created from 2015 data, with the data set from a second season, produced a high RMSEP error. The results confirmed that PLS alone cannot deal with different batch effects.
Using the three options of model improvement in the software did reduce this error. However, the results from the options varied.
In the first option, the software selected twenty variables, most of which were related to the moisture in the fresh fruits. This CovSel variable selection reduced RMSEP error by 18%; see Figure 3.
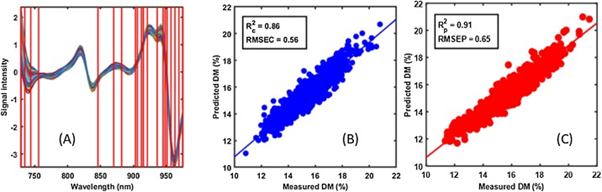
Figure 3: “Results of covariate selection (CovSel) and calibration for dry matter (DM %) prediction in apples. (A). Selected variables (vertical red lines), (B). calibration set, and (C). test set. R2c: Coefficient of determination for calibration set, R2p: coefficient of determination for the test set, RMSEC: root mean squared error of calibration, and RMSEP: root mean squared error of prediction,” Mishra et al, 2021. (Image credits: Postharvest Biology and Technology, 175, 111414. doi:10.1016/j.postharvbio.2020.111414).
In the second option, using DOP correction, the cross-validation of PLS showed that the RMSEP was reduced by 29%. Hence, DOP correction is better than variable selection in improving the model for apples.
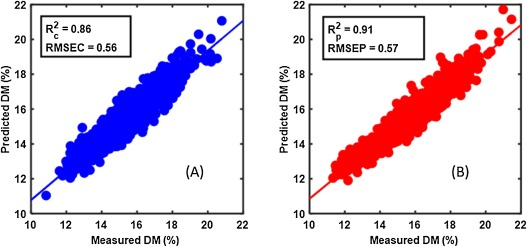
Figure 4: “Partial least-squares (PLS) regression calibration and testing after dynamic orthogonal projection (DOP) correction. (A) Calibration set, and (B) test set. R2c: Coefficient of determination for calibration set, R2p: coefficient of determination for the test set, RMSEC: root mean squared error of calibration, and RMSEP: root mean squared error of prediction,” Mishra et al, 2021. (Image credits: Postharvest Biology and Technology, 175, 111414. doi:10.1016/j.postharvbio.2020.111414).
The third option, transfer component analysis, corrected data to reduce RMSEP by 16%. Thus, this approach to model improvement was the least effective for predicting DM in apples.
Given the varying performance of the three approaches, the scientists recommend that users try them all. People should choose the approach that gives them the least RMSEP error.
The software offers a push-button to choose the different approaches and carry out the different steps, making it easy and user-friendly. Even non-specialists or people trying chemometric modeling for the first time can improve the model by using this new free downloadable software.
Making Science Approachable
Some common fruits like apple, mango, or banana are grown worldwide and there are bound to be differences in the chemical composition of fruits for a variety of reasons. User-friendly software, such as FRUITNIR-GUI, make NIRS tools more versatile, as they can now be fine tuned for a range of growing conditions. In this way, fruit quality control and monitoring through NIRS in the entire supply chain become more accurate and reliable.
—
Vijayalaxmi Kinhal
Science Writer, CID Bio-Science
Ph.D. Ecology and Environmental Science, B.Sc Agriculture
Source
Mishra, P., Roger, J. M., Marini, F., Biancolillo, A., & Rutledge, D. N. (2021). Fruitnir-gui: A graphical user interface for correcting external influences in multi-batch near infrared experiments related to fruit quality prediction. Postharvest Biology and Technology, 175, 111414. doi:10.1016/j.postharvbio.2020.111414
S.L. Teh, J.L. Coggins, S.A. Kostick, K.M. Evans. (2020). Location, year, and tree age impact NIR-based postharvest prediction of dry matter concentration for 58 apple accessions Postharvest Biol. Technol., 166, 111125, 10.1016/j.postharvbio.2020.111125
Related Products
- F-751 Grape Quality Meter
- Custom Model Building
- F-910 AccuStore
- F-751 Melon Quality Meter
- F-751 Kiwifruit Quality Meter
- F-750 Produce Quality Meter
- F-751 Avocado Quality Meter
- F-751 Mango Quality Meter
- F-9XXDK Dynamic Sampling Kit
- F-900 Portable Ethylene Analyzer
- F-950 Three Gas Analyzer
- F-920 Check It! Gas Analyzer
- F-960 Ripen It! Gas Analyzer
- F-940 Store It! Gas Analyzer
Most Popular Articles
- Spectrophotometry in 2023
- NIR Applications in Agriculture – Everything…
- The Importance of Food Quality Testing
- The 5 Most Important Parameters in Produce Quality Control
- Melon Fruit: Quality, Production & Physiology
- Fruit Respiration Impact on Fruit Quality
- Guide to Fresh Fruit Quality Control
- Liquid Spectrophotometry & Food Industry Applications
- Ethylene (C2H4) – Ripening, Crops & Agriculture
- Understanding Chemometrics for NIR Spectroscopy