Understanding Chemometrics for NIR Spectroscopy
cid_seo
January 29, 2021 at 11:11 pm | Updated August 29, 2022 at 9:54 pm | 10 min read
Chemometrics is a multidisciplinary approach referring to the analysis of large, complex chemical data obtained from spectroscopic measurements. Chemometric tools are used in research, quality control, and in food processing. They are useful for a wide variety of professionals such as chemists, technologists, agricultural scientists, microbiologists, engineers, farmers, suppliers, distributors, and retailers.
Chemometrics Defined
Svente Wold coined the term “Chemometrics” in 1972.
Chemometrics is a multidisciplinary approach to extract information from chemical systems by using mathematics, multivariate statistics, and computer science. The information gathered from chemistry is used to understand the condition of a system and its processes so that people can make decisions.
Subscribe to receive our monthly round-up of articles.
It is used to design experiments and analyze chemical data in measurement procedures. The two broad categories of chemometric applications are qualitative and quantitative.
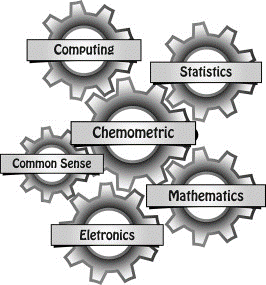
Figure 1. The different disciplines of computing, statistics, mathematics, electronics, and common sense are used in chemometrics to analyze chemical data, Ferreria, 2005. (Image credits: https://doi.org/10.1016/B978-0-12-409547-2.14536-6)
With the advent of computers and electronics, chemometric analysis has found a wide range of applications, as it is capable of handling large volumes of data; see Figure 1. Nowadays, chemometric models drive faster analysis of results and product development.
Chemometric Models
In older classical methods of data analysis, only one factor is examined at a time to understand its effect. Therefore, the model is based on a prior theory, and data of only one variable is tested. This differs from chemometrics, where multivariate methods are deployed, and all variables are considered.
There are advantages and disadvantages to both approaches and scientists consider new chemometric models as complementary to the old classical methods. Moreover, chemometric methods can provide information that classical models cannot.
There are many methods of chemometrics, but they all have the following steps in common:
- Measuring and collecting data
- Preprocessing data
- Multivariate Analysis: Selection of model
- Calibration
- Validation
Each of these steps will be briefly described below, without going in-depth into the mathematics, to give an overview of how chemometric analysis is used in food science.
Preliminary Steps
Modelling is key to chemometric tools; however, the other aspects, including the two preliminary steps, are also crucial.
Measuring and Data Collection
Scientists are aiming to increase the amount and rate of data collection to apply it in studying the physical or chemical properties of food. As a result, we now have a vast amount of data that needs to be analyzed. Without a means of analysis, it is not possible to extract useable information from raw data.
It is here that chemometrics is used. This discipline handles data from various sources and of different natures. The following are some of the common forms of chemical data:
- Physical measurements that can be discrete and continuous, of concentrations, temperature, melting points, viscosity, etc.
- Spectroscopic measurements using near-infrared, Raman, and fluorescence radiation
- Chromatographic measurements through gas chromatography and high-performance liquid chromatography (HPLC)
The collection of data and its measurement are the most critical parts of chemometric tools, which also have to convert this data and transfer it to the software for analysis.
Chemometrics and Spectroscopy
In the food industry, fluorescence, near-infrared (NIR), and visual (Vis) spectroscopy are the data most often used. NIR spectroscopy is popular because this radiation band is most suitable for testing organic compounds made of carbon, hydrogen, and oxygen.
Vis-NIR spectroscopy offers a non-destructive, precise, and rapid means of data collection from a wide range of food, and it requires little sample preparation. However, the spectral data is difficult to analyze. Therefore, chemometrics tools that collect and analyze the spectral data of light absorbed, reflected, and transmitted by food are widespread in commercial and laboratory spheres.
Preprocessing
After data collection, the second step is preprocessing. The main purpose of this step is to identify and remove outliers. Outliers are data that do not belong to the bulk of observations made, so they can be omitted without influencing the outcome. There are several established mathematical ways to do this. The following are the most common ones used in chemometrics:
- Mean Centering
- Normalization
- Baseline Correction
- Detrending
- Derivative processing
- Orthogonal Signal Correction
- Savitsky-Golay Derivatisation
- Multiplicative Signal Correction
Multivariate Analysis: Model Selection
Chemometrics can analyze multiple sets of measurements from various samples or, if they are of various wavelengths, simultaneously provide information about the chemistry of the sample.
The multivariate approach of chemometrics is one of its most important features.
Different chemometric analysis methods are needed to extract qualitative or quantitative information from the chemical data. The result of the analysis is a model, which will be chosen to make future predictions. This model can then be produced as software and used in food science tools.
In each case, several methods can be used, and the most common ones are mentioned below:
- Qualitative chemometrics models, which analyze components, use mathematical principles such as Classical Least Squares (CLS), Independent Component Analysis (ICA), Multivariate Curve Resolution (MCR), and Principal Component Analysis (PCA).
The resultant models used for prediction could be Boosted Trees, Linear Classifiers, Mahalanobis Distance Metrics, Nearest Neighbor, Random Forest, etc.
- Quantitative chemometrics models could be based on principles of Locally Weighted Regression (LWR), Multiple Linear Regression (MLR), Neural Networks (NNs), Artificial Neural Networks (ANN), Partial Least Squares (PLS), or Principal Component Regression (PCR).
Some of the resultant algorithms and models used in quantitative prediction are Soft Independent Modeling by Class Analogy (SIMCA) and Support Vector Machines (SVMs).
The most used mathematical methods in food chemistry are PCA for qualitative modeling and PLS for quantitative modelling. These two approaches will be discussed more in detail. Both of these methods need preprocessing of data through normalization and scaling, but these steps do not interfere with the integrity of the analysis.
Qualitative Chemometrics
Qualitative chemometrics is necessary to determine if a sample belongs to a group. For example, it would be used to determine if a particular package of ground meat comes from a cow or horse. These are also called classification models or pattern recognition models.
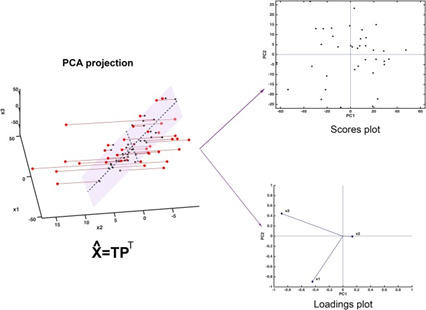
Figure 2: “Graphical illustration of the basics of PCA. The samples, here represented in a three-dimensional space, are projected onto a low-dimensional subspace (highlighted in light red in the leftmost panel) spanned by the first two principal components. Inspection of the data set can be carried out by looking at the distribution of the samples onto the informative PC subspace (scores plot) and interpretation can be then carried out by examining the relative contribution of the experimental variable to the definition of the principal components (loadings plot),” Biancolilio and Marini 2018. (Image credits: DOI: 10.3389/fchem.2018.00576)
To simplify data for analysis, a PCA reduces the number of dimensions. In Figure 2, the data for analysis is limited to those in the light pink zone.
For example, if data was collected of two varieties of fruits and the variables were absorbance, reflectance, and transmittance, the PCA will choose the main feature that shows maximum variation as its x-axis and the variable with the second-highest source of variation as the Y-axis. The main principal component (PC), or axis, follows the feature that shows the maximum variation, followed by the second, and the third.
The samples are plotted using the new coordinates, called scores, in the score plot, as explained in Figure 2. The PCA groups similar samples together in clusters. The distance between the clusters shows the degree of similarity or difference of samples. The most important variables contributing to the distribution of samples in the PCA can be found through the loadings plot.
Figure 3 explains how PCA separates tablets of ibuprofen (blue) or ketoprofen (red), based on their spectral data. The first principal component (X-axis) can explain 79.8% of the variation seen in the data, and the second PC explains 10.28% of the variation in samples.
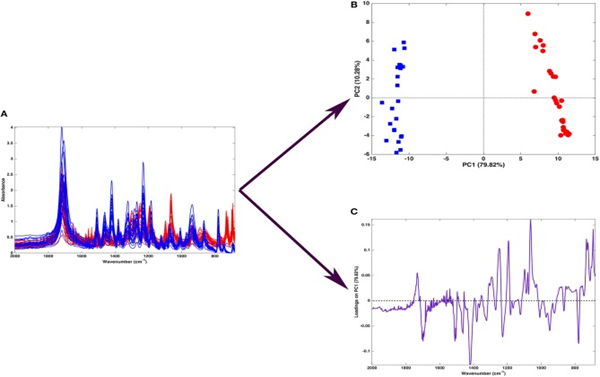
Figure 3: “Graphical illustration of the application of PCA on a spectral (mid-infrared) data. Fifty-one spectra recorded on samples containing either ibuprofen (blue) or ketoprofen (red) are recorded in the region 680–2,000 cm−1 (A). When PCA is applied to such a dataset, one obtains a scores plot (B) showing that two clusters of samples, corresponding to tablets containing ibuprofen (blue squares) or ketoprofen (red circles) are separated along with the first component. Interpretation of the observed differences in terms of the spectroscopic signal is made possible by the inspection of the loadings on PC, which are shown in a ‘spectral-like’ fashion in,” Biancolilio and Marini 2018. (Image credits: DOI: 10.3389/fchem.2018.00576)
The following are the advantages of using PCA for chemometrics:
- Does not require wavelength selection
- Can be used with a very complex mixture, even though there is no prior knowledge of its constituents
- Can find contaminants or new ingredients that are not present in the original calibration mixtures
The following are the disadvantages of using PCA for chemometrics:
- Requires a large number of samples to achieve comprehensive calibration
- The model can be difficult to understand and interpret
Quantitative Chemometrics
When the concentration of a compound in a sample is required, quantitative chemometrics are used. This would be the case when determining the total soluble solids in fruit, for example.
The most common quantitative method, called PLS- discriminant analysis, is a complex form of regression, which uses the basic calibration equation:
Y = Xb,
where “Y” is the concentration data, “X” is the spectra, and “b” is the resultant model.
To create this model, both the X (the predictor) and Y (the response) must be known to find the parameter “b” that can predict Y using a given value of X.
Because many variables are involved in PLS, a matrix of predictors is used, called matrix X and matrix Y. Matrix X could be spectra, and matrix Y is the response matrix that is to be predicted, such as concentrations. A selected model involves all the “b” parameters.
This method also has its advantages and disadvantages for chemometrics. The following are advantages of PLS:
- It can analyze data that has concentrations as well as spectra, as it uses matrices for both variables. Moreover, PLS uses the correlation between the two, as spectra are defined by the concentrations.
- It can sometimes find contaminants by identifying them as outliers.
The following are disadvantages of PLS:
- If spectral data is used, a training of the system is needed with samples of known concentrations.
- The predictive power of the model depends on the calibration set being comprehensive enough to cover all possible variations.
Calibration and Validation
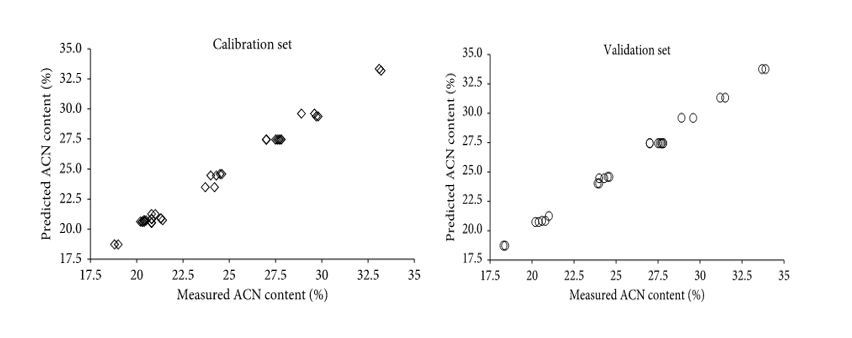
Figure 4: “Reference measured versus the predicted value of calibration (a) and validation (b) samples for total anthocyanins (%) in bilberry extracts using the PLS model,” Gardana et al. 2018. (Image credits: https://doi.org/10.1155/2018/4751247)
It is important to note that data is used for calibration and validation of models in both qualitative and quantitative chemometric analysis.
The creation and choice of the model are based on calibration data, while validation data is used to test the predictive performance of the chosen model. Usually, 25% of data is used for calibration and 75% for validation.
If the dataset used in calibration is used to validate the model, it is called cross-validation, and it is not very vigorous. True validation uses new data sets, and the Root Mean Square Error in Prediction (RMSEP) judges its quality.
Chemometrics and Food Chemistry
The use of Vis-NIR spectroscopy based chemometric tools, which process spectral data, has increased in the last 30 years and has an important application in various stages of the food supply chain.
In fact, most chemometric tools are used to probe food chemistry. The need for new techniques and strategies to control and monitor food quality has led to the development of new chemometric methods.
Internal food chemistry and sensory attributes are correlated to consumer preferences. Moreover, quality control in farms, storage, food processing, and distribution all require the use of chemometrics.
The need to meet stringent quality control standards, consumer sensory satisfaction, enhanced nutritional value, extend shelf life, and produce more food make chemometric tools that probe the internal chemistry of food vital to the whole industry.
Chemometrics is useful to predict dry matter content, total soluble solids, pH, titrable acidity, fat, proteins, water content, phenols, etc.
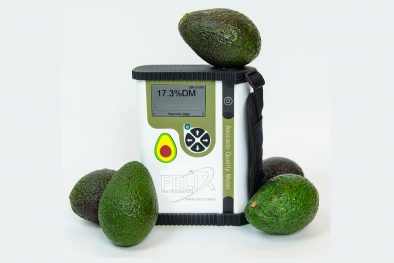
Portable NIR chemometric tools, such as the F-750 Produce Quality Meter, F-751-Avocado Quality Meter, F-751-Mango Quality Meter, and F-751-Kiwi Quality Meter, use the combination of Vis-NIR spectroscopy and chemometrics to fix harvest time, ripeness, quality during storage and distribution for fruits, vegetables, grains, cheese, fish, poultry, meat, dairy, oil, coffee, honey, wine, etc.
Chemometrics and Food Analysis
The combination of chemometrics and spectroscopy has produced several important applications in food research and innovation. Some of the most common are listed below:
- Identify biochemical markers to ensure food quality and safety.
- Differentiate farming systems and agricultural methods used.
- Ensure the authenticity quality and nutritional content of food by differentiating geography and genetic origin.
- Detect food additives or contaminants.
- Create mathematical models to monitor food processing and predict processed foods’ shelf life.
- Study and establish the relationship between internal composition, sensory attributes, and texture to maximize consumer satisfaction.
- Microbiological analysis of food spoilage, associated pathogens such as Salmonella, and yeast to make bread and wine.
Qualitative chemometric models based on PCA are used for authentication, tracing geography or genetic origin, and detecting contaminants, whereas quantitative chemometric methods based on PLS are used to find concentrations of food components, such as levels of dry matter, sugars, etc., to control quality and fix harvest time.
Chemometrics is Vital for the Food Industry
Today, chemometrics and food analysis go hand-in-hand. Thanks to innovation in electronics, computing, and the miniaturization of sophisticated data collection methods researchers and stakeholders can glean information on complex internal chemistry in real-time. While scientists working in the field of agriculture, food sciences, chemistry, policy-making, etc. regularly use the precision and reliability of chemometrics, the information is also simple enough to be understood and utilized effectively by those without a chemistry education.
—
Vijayalaxmi Kinhal
Science Writer, CID Bio-Science
Ph.D. Ecology and Environmental Science, B.Sc Agriculture
Feature image courtesy of Hunter Harritt.
Sources
Andre, C.M., & Soukoulis, C. (2020). Food Quality Assessed by Chemometrics. Foods 9(7):897. https://doi.org/10.3390/foods9070897
Biancolillo, A., & Marini, F. (2018). Chemometric Methods for Spectroscopy-Based Pharmaceutical Analysis. Frontiers in Chemistry, 6, 576. https://doi.org/10.3389/fchem.2018.00576
Chemometrics. (n.d.). Retrieved from http://ww2.chemistry.gatech.edu/class/6282/janata/Multivariate_Methods_Nutshell.pdf
Dearing, T. (n.d.). Fundamentals of Chemometrics and Modeling. Retrieved from https://depts.washington.edu/cpac/Activities/Meetings/documents/DearingFundamentalsofChemometrics.pdf
Ferreira, S.L.C. (2019). Chemometrics and Statistics | Experimental Design. In Worsfold, P., Poole, C., Townshend, A., & Miró, M. (Ed.). Encyclopedia of Analytical Science (Third Edition), (pp. 420-424), Academic Press. https://doi.org/10.1016/B978-0-12-409547-2.14536-6
Forina, M., Casale, M., & Oliveri, P. (2009). 4.04. Application of Chemometrics to Food Chemistry. In Brown, S.D., Tauler, R., & Walczak, B. (Eds.), Comprehensive Chemometrics, (pp. 75-128). Elsevier,
Gardana, C., Scialpi, A., Fachechi, C., & Simonetti, P. (2018). Near-Infrared Spectroscopy and Chemometrics for the Routine Detection of Bilberry Extract Adulteration and Quantitative Determination of the Anthocyanins. Journal of Spectroscopy, 2018. https://doi.org/10.1155/2018/4751247
Granato, D., Putnik, P., Kovačević, D.B., et al. (2018). Trends in Chemometrics: Food Authentication, Microbiology, and Effects of Processing. Comprehensive Reviews in Food Science and Food Safety 17 (3). https://doi.org/10.1111/1541-4337.12341
Guidetti, R., Beghi, R., & Giovenzana, V. (2012). Chemometrics in Food Technology, Chemometrics in Practical Applications, IntechOpen, DOI: 10.5772/34148. Available from: https://www.intechopen.com/books/chemometrics-in-practical-applications/chemometrics-in-food-technology
Heberger, K. (2008). Chapter 7. Chemoinformatics—multivariate mathematical–statistical methods for data evaluation. In Vékey, K., Telekes, A., & Vertes, A. (Ed.). Medical applications of mass spectrometry. (pp.141-169). England: Elsevier, Science Publishing CO INC (NY). https://doi.org/10.1016/B978-044451980-1.50009-4
Marini, F. (2013, Feb 28). Coupling NIR spectroscopy and chemometrics for the assessment of food quality. Retrieved from https://www.newfoodmagazine.com/article/10096/coupling-nir-spectroscopy-and-chemometrics-for-the-assessment-of-food-quality/
Sádecká J., & Tóthová J. (2007). Fluorescence spectroscopy and chemometrics in the food classification − a review. Czech J. Food Sci., 25: 159-174. DOI: 10.17221/687-CJFS
Workman, J., & Mark, H. (2020, Aug 1). A Survey of Chemometric Methods Used in Spectroscopy. Spectroscopy, 35(8), 9–14. Retrieved from https://www.spectroscopyonline.com/view/a-survey-of-chemometric-methods-used-in-spectroscopy
Related Products
- F-751 Grape Quality Meter
- Custom Model Building
- F-910 AccuStore
- F-751 Melon Quality Meter
- F-751 Kiwifruit Quality Meter
- F-750 Produce Quality Meter
- F-751 Avocado Quality Meter
- F-751 Mango Quality Meter
- F-9XXDK Dynamic Sampling Kit
- F-900 Portable Ethylene Analyzer
- F-950 Three Gas Analyzer
- F-920 Check It! Gas Analyzer
- F-960 Ripen It! Gas Analyzer
- F-940 Store It! Gas Analyzer
Most Popular Articles
- Spectrophotometry in 2023
- NIR Applications in Agriculture – Everything…
- The Importance of Food Quality Testing
- The 5 Most Important Parameters in Produce Quality Control
- Melon Fruit: Quality, Production & Physiology
- Fruit Respiration Impact on Fruit Quality
- Guide to Fresh Fruit Quality Control
- Liquid Spectrophotometry & Food Industry Applications
- Ethylene (C2H4) – Ripening, Crops & Agriculture
- Understanding Chemometrics for NIR Spectroscopy