Creating a Predictive Apple Quality Model with NIRS
Scott Trimble
February 2, 2022 at 11:29 am | Updated April 20, 2022 at 11:36 am | 5 min read
The two most often-used fruit quality parameters are soluble solid content (SSC) and dry matter (DM). Unfortunately, conventional measurements are destructive, laborious, and time-consuming. So, near-infrared spectroscopy tools, which can take non-destructive quality measurements throughout the supply chain, are gaining popularity. Building and selecting the proper models to analyze the near-infrared spectra can make all the difference to the accuracy of these tools.
Developing NIR Spectroscopy Models for Apple Cultivars
Early Near-Infrared (NIR) spectroscopy models for apples were built using single cultivars but used for many other varieties.
Hence, Zhang, Nock, Al Shoffe, and Watkins, horticulturists from Cornell University, developed multi-cultivar and individual models to predict SSC and DM of eight apple (Malus × domestica Borkh) varieties:
Subscribe to receive our monthly round-up of articles.
- ‘Gala’
- ‘Honeycrisp’
- ‘Mclntosh’
- ‘Jonagold’
- ‘NY1′ (SnapDragon™)
- ‘NY2 (RubyFrost™)
- ‘Fuji’ and
- ‘Red Delicious’
Usually, only internal validation is used to test prediction models, so the horticulturists also used an external validation set to test the calibrations.
Harvesting the Fruits
The fruits of the eight cultivars were harvested in 2016 from the Cornell University orchards at three locations – Ithaca, Geneva, and Lansing. The scientists gathered 640 uniform fruits of seven cultivars, but only 560 of ‘Red Delicious’ due to preharvest drop.
In the second year of the experiment, the scientists collected apples of all eight varieties from the three initial locations, as well as commercial orchards in Hudson Valley and Western New York. The number of fruits collected from each cultivar varied from 160 to 280, depending on the number of harvests.
The scientists measured the apples’ quality parameters each year on harvest day and after several storage lengths. In 2016, fruits were evaluated after 4, 8, and 12 weeks of air storage, and after 8, 16, and 24 weeks in controlled atmosphere (CA) storage.
In 2017, evaluations were limited to 8 weeks in air and 24 weeks in CA storage.
Fruit Evaluations
The harvest indices estimated were delta absorbance (IAD), firmness, and starch pattern index (SPI), using four replicates of ten fruits on the day of harvest.
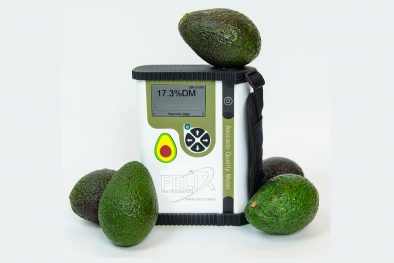
The horticulturists wanted to employ a tool that used NIR interactance as the scanning mechanism. Ultimately, they chose a commercially available NIR spectrophotometer, the F-750 Produce Quality Meter.
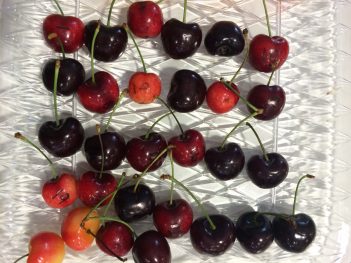
The Produce Quality Meter, produced by Felix Instruments – Applied Food Science, has a Carl Zeiss MMS-1 spectrometer. The tool was determined to be reliable, as many previous studies had used it to estimate quality parameters in fruits and vegetables like apples, cherries, mangoes, pears, tomatoes, onions, and garlic.
Spectral data were collected in the range of 310 to 1100nm, at 3nm resolution. Since spectra can be affected by temperatures, fruits were kept at 20°C for 4 hours prior to evaluation on harvest day. Stored fruits were stabilized at the same temperature for 24 hours.
Scientists placed each fruit on the lens of the NIR tool, on its equatorial side, and the scanned area was marked. 2.7cm bore samples were then taken from the marked areas to collect reference data for SSC and DM. The researchers estimated SSC using refractometers and DM by oven drying.
Chemometrics
Predictive models were built using chemometrics to analyze the spectra and estimate SSC and DM.
The horticulturists used the Felix Instruments software and spectral data from the fruits collected in 2016 to develop calibration models using Partial Least Square Regression (PLSR).
The calibration models were tested by internal and cross/external validation to assess model accuracy. Internal validation used data from 2016, which was part of the same data set used to calibrate the model.
Some fruits from 2016 were also set aside for the first round of cross-validation. During the “leave-one-out” cross-validation, the researchers held back one sample from the data set to calculate the reduction residual; the rest were used in the validation. The tests were repeated until every fruit sample had been left out once from the testing data set.
Fruits from 2017 were used for further “leave-one-out” cross-validation.

Multi-cultivar vs. Individual Predictive Models
Some wavelengths were excluded to make quality estimations more accurate. These included the wavelengths absorbed by chlorophyll (678nm) and anthocyanins (520nm and 700nm) in the fruit peel. The scientists also did not use wavelengths below 400nm and the visible range. Instead, only the range between 729-975nm, absorbed by carbohydrates, sugar, and water, was used.
The horticulturists found variations between the spectra of each cultivar and season, as can be seen in Figure 1. Second derivative spectral data were used for modeling, as they showed the best correlation with reference values.
Individual models built for each cultivar were successful.
- The best model was for ‘Jonagold.’ It had the highest RC2 of 0.86, with RMSE of 0.42 % for SSC and RC2=0.91 and 3.88 g kg−1 for DM.
- The model with the lowest predictivity was ‘NY2′. It had a low RC2 =0.77, with RMSE of 0.34 % for SSC, and RC2 =0.60 and RMSE of 4.12 g kg−1 for DM.

The horticulturists found that models for cultivars with less deviation in parameter values and high consistency had low predictive power. However, they decided the model’ NY2′ was acceptable for use, as its RMSE values were low and similar to the models for other apples.
The multi-cultivar models were found to have the highest predictive powers, as they were based on a much wider range of SSC and DM values gathered from the eight varieties.
Internal validation showed a slightly higher R2 value for individual models than for the multi-cultivar model, suggesting that individual models are better. However, this was a result of over-fitting, as the same data set was used for validation and calibration. So, while individual models seem to be successful in internal validation, they have low predictive accuracy when analyzing new data with more variability and external influences. Model performance during external validation with 2017 data clearly revealed this shortcoming in individual models.
The 2017 apples experienced different seasonal effects and were collected from a wider range of orchards. As a result, the SSC and DM values in 2017 were different from 2016, even for each cultivar.
Multi-cultivar models also did show fluctuations in R2 and lower predictive accuracy in external validation, but the scientists expect that compared to individual models, these models would be more robust and practical to use.
The horticulturists suggest that ideal apple models would be individual predictive models for each cultivar and that these models should be built using data from trees in different locations, seasons, maturity periods, and storage periods.
The scientists found no influence of storage time and method in this experiment.
Near-Infrared Spectroscopy
Consumer preference for apples is related to soluble solids content (SSC) as it can predict sweetness and internal quality. While dry matter (DM) at harvest can be a good predictor of post-storage SSC.
NIR spectroscopy, is being used for quality estimation in many fruits as an alternative to conventional, tedious, and destructive methods of testing. This is especially valuable since fruits must be monitored several times from pre-harvest to post-storage.
NIR spectroscopy, which uses radiation between 780-2500nm, can be used for the detection and quantification of bio-chemicals as it is sensitive to hydrogen bonds with carbon, oxygen, and nitrogen. Moreover, water absorbs this range of light, making it useful for fresh produce with high water content, like apples.
Portable NIR Tools
In the current experiment, the horticulturists addressed gaps in model building for apple varieties, providing valuable insights. They suggest that more data covering variations in seasons, regions, and varieties strengthens the prediction performance of a NIR-based tool. The existing commercially available tools like F-750 Produce Quality Meter, can be used to predict SSC and DM on the farm to determine harvest maturity and also post-storage fruit quality. The performance of these tools can be further enhanced by using improved individual chemometric models.
Related Products
- F-751 Grape Quality Meter
- Custom Model Building
- F-910 AccuStore
- F-751 Melon Quality Meter
- F-751 Kiwifruit Quality Meter
- F-750 Produce Quality Meter
- F-751 Avocado Quality Meter
- F-751 Mango Quality Meter
- F-9XXDK Dynamic Sampling Kit
- F-900 Portable Ethylene Analyzer
- F-950 Three Gas Analyzer
- F-920 Check It! Gas Analyzer
- F-960 Ripen It! Gas Analyzer
- F-940 Store It! Gas Analyzer
Most Popular Articles
- Spectrophotometry in 2023
- NIR Applications in Agriculture – Everything…
- The Importance of Food Quality Testing
- The 5 Most Important Parameters in Produce Quality Control
- Melon Fruit: Quality, Production & Physiology
- Fruit Respiration Impact on Fruit Quality
- Guide to Fresh Fruit Quality Control
- Liquid Spectrophotometry & Food Industry Applications
- Ethylene (C2H4) – Ripening, Crops & Agriculture
- Understanding Chemometrics for NIR Spectroscopy