NIR Spectroscopy to Assess Food Adulteration in UBF
Scott Trimble
March 17, 2022 at 11:59 am | Updated May 2, 2022 at 6:50 am | 8 min read
Unripe banana flour (UBF), also called green banana flour, has the potential to increase food and nutrition security because of its many health benefits. However, standards to control and regulate food safety and technologies that can be used for quality control of this lucrative product are missing in many countries, allowing adulteration with cheaper and low-value flour. A recent doctoral study from South Africa found solutions to fill the knowledge gap using a commercially available NIR spectroscopy-based device.
The Need for Quality Control in Banana Flour
Processing of fully mature green bananas (Musa acuminate and M. balbisiana) to produce unripe banana flour is just starting in South Africa. But adulteration rates of this remunerative gluten-free and nutrition-rich alternative to flour are already reaching as high as 80%. Low-cost, edible wheat and maize flour with similar color, texture, and taste are the common substitutes. Due to the similarities, detecting the adulterants from unripe banana flour isn’t easy.
Since 20-50% of harvested bananas go to waste each year in the country due to poor post-harvest handling, this new product can cut food loss and increase ROI for farmers and suppliers. It can replace flour from genetically modified organisms and prevent health risks to people.
Subscribe to receive our monthly round-up of articles.
Hence authentication of the unripe banana flour (UBF) is necessary to ensure consumer health and improve trade and export possibilities.
Wet chemistry through traditional laboratory methods, mass spectroscopy, liquid chromatography, and enzyme-linked immunosorbent assays can be used to find adulteration. However, they are time-consuming, manually laborious, and require trained staff and chemical reagents. Moreover, they detect single compounds, making the control for all potential adulterants expensive.
NIR Spectroscopy, a Possible Solution
Phindile Faith Ndlovu devised an experiment to determine whether visible near-infrared (vis-NIR) spectroscopy–a precise, rapid, and non-destructive method t–could be a better alternative for authentification. Although NIR spectroscopy has been tested for other foods, it has not been tested for UBF.
For her doctoral thesis published in 2021, the researcher wanted to test the following:
- If NIR spectroscopy could discriminate between UBF and single and mixes of adulterants.
- The chemometric prediction models using Principal Component Analysis (PCA) for unsupervised classification and partial least squares regression (PLSR) could predict the quantities of the adulterants.
- Find the quality parameters that could effectively differentiate UBF from staple adulterant flours.
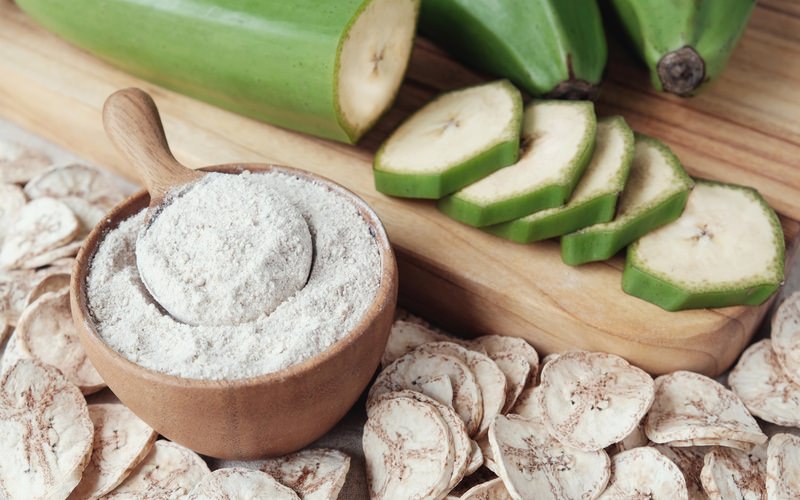
For all the experiments, UBF preparation followed the steps shown in Figure 1, where mature bananas were harvested, treated, dried, and ground. Fruits from around twenty-three cultivars were selected, and the flour from all these varieties was mixed to produce a composite flour.

Detecting and Quantifying Wheat Flour Adulteration
Adulteration with wheat flour was simulated using 0 to 800 g of wheat flour for one kilo of UBF at intervals of 20g. The nutritive value of UBF and wheat flour was determined before the experiment.
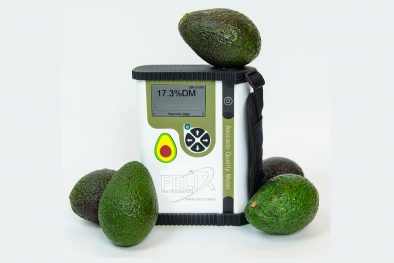
A five-gram sample of adulterated flour was evenly spread in a petri dish and scanned three times with the F-750 Produce Quality Meter at different temperatures. The portable NIR assessment tool measured absorbance and reflectance spectra at 3 nm intervals.
The chemometric analysis included preprocessing using Savitsky-Golay to get the first and second derivatives, baseline correction, and standard normal variate. The data was then analyzed by PCA and PLSR.
The spectra of adulterated and unadulterated UBF were similar except at some specific wavelengths, suggesting that wheat and UBF composition are largely comparable, see Figure 2.

The distinctive wavelengths 479-483 nm, 519 nm, 573 nm, and 654 nm correspond to the chromophores, which are molecules that color food.
The first and second components of PCA explained over 90% of the variance in the data. The PCA was able to detect and classify pure UBF and differentiate four categories of adulteration, as shown in Figure 3.
The predictions by PLSR models were also accurate. Pretreatment with Savitsky-Golay improved the calibration (R²=0.991) and validation (R²=0.993) of models. Residual predictive deviation (RPD) verification values were above “3,” showing that the models are reliable. So the PLSR models are helpful in the detection of UBF adulteration by wheat flour.

PLSR Models to Detect Maize Adulteration
Using the prepared UBF, adulteration by maize flour was simulated by adding and mixing 20 to 800g per kilo of UBF in increments of 2%.
Here, the researchers again utilized the Produce Quality Meter, manufactured by Felix Instruments. This experiment collected only absorbance spectra at 3 nm at 20ºC. The researchers took three scans of pure UBF and pure maize before moving on to UBF adulterated with maize.
Before chemometrics, bands with noise were removed, and the spectra between 447 to 1020 nm were split into visible and NIR segments for chemometric analysis.
The spectra of pure UBF were similar to that of adulterated UBF, but the intensity differed. Pure maize saw an absorbance peak higher than those of both pure and adulterated UBF.
Of all the preprocessing techniques, 1st derivative of Savitsky-Golay gave the best results when analyzed by PLSR models. The difference in maize and UBF was due to pigmentation, moisture content, proteins, and carbohydrates.
Validation with the external data showed that the models were robust for maize adulteration detection at various temperatures.

The separate visible and NIR spectra models were able to predict adulteration with an R² of 90-96% accuracy, see Figure 4. Therefore, they are suitable for a rough estimation of adulteration, as the residual predictive deviation (RPD) values are between 3.23 to 3.60.
However, the author found the model that combined the visible and NIR spectra was more accurate even with raw data without preprocessing. This model had an R² of 0.955 for calibration and R²= 0.961 for validation, and RPD over 5. For validation, through test sets, the model had an RPD over 3.
So all these models can detect and quantify maize adulteration in UBF.
Combined Adulteration with Wheat and Maize
In the third experiment, the scientist tested if the Produce Quality Meter could collect spectra of UBF, adulterated simultaneously by wheat and maize, at various concentrations and the efficacy of model estimation.
For this experiment, UBF was collected from 22 cultivars of bananas. Wheat and maize from local markets were used to simulate adulteration between 20-800g/ kilo of UBF separately. Then the UBF contaminated by the two adulterants was mixed to get a composite mixture.
Researchers used the F-750 to collect reflectance data at 3 nm intervals between 315 to 1200 nm. A five-gram sample was used, split into Petri dishes. Spectra of pure UBF, wheat, and maize samples were also collected for comparison.
Noisy spectra were discarded, and only the range between 444 to 1026 was used for analysis. Of the collected spectral data, 75% were used for calibration, and 25% were set aside for validation.
The spectra from pure samples differed, with absorbance peaks at different wavelengths.
Several preprocessing methods were used to remove effects due to varying particle size, light scatter, and to smooth data. These methods were the first and second derivatives of Savitsky-Golay, baseline correction, and standard normal variate.
PCA and PLSR models were developed and run for qualitative and quantitative analysis, respectively, for spectra from each preprocessing and installed into the device for testing.
The calibration models for PLSR used the leave-one sample out cross-validation method.
In this experiment, the first derivative of Savitsky-Golay was the best preprocessing method. The PCA classified the data into 12 groups. Three groups represented the pure samples of UBF, wheat, and maize, while nine differentiated the adulterated samples, see Figure 5. Samples with lower concentrations of adulteration are closer to the pure UBF.

The PLSR models were also good, and though the predictive strength differed based on the preprocessing method, they all had RPD over “3” and satisfactory R² and low RMSE.
The models from the 1st derivative of Savitsky-Golay had the highest R² of 0.99 and the highest RPD of 10.88.
Gluten as Biomarker
Part of the premium price UBF commands is because it provides a gluten-free alternative. For consumers’ health, it is necessary to ensure that gluten concentrations are not above 20mg/kilo of flour. Wheat gluten is an allergen, and even minute quantities of wheat adulterants will have to be detected.
So gluten could also be used as a biomarker for quality control of food safety and authentication.
Instead of time-consuming and tedious liquid chromatography, mass spectroscopy, or polymerase chain reaction, detection by NIR-spectroscopy could be a boon.
Hence, the scientist used PLSR models to analyze the NIR spectra from UBF samples adulterated by 0, 2, 10, 20, 30, 40, 50, 60, 70, 80, 90, and 100% wheat flour. In addition, three samples of each adulteration level and pure UBF and wheat were also used. This time, researchers employed a monochromator spectroscopy-based instrument, and samples were placed in quartz holders to collect reflectance spectra.
The samples were then used to extract and analyze gluten and gliadin content by enzyme-linked immunosorbent assays.
About 70% of the spectra were used for calibration and the rest for validation. Before analysis, they were preprocessed for noise and scatter by baseline and standard normal variate.
Pure UBF had no gliadin and gluten, while pure wheat had 43.2 and 86.40 mg of gliadin and gluten per kilo of flour, respectively, and was also rich in proteins.
Due to quantified proteins, there was a difference in the spectra of adulterated and unadulterated UBF in the light spectrum of 1202-2392 nm.
The best PLSR model was the one that combined the two preprocessing methods. This model predicted the quantities of wheat gluten with an accuracy of R² of 0.94, and the model was determined to be reliable, as the RPD was 3.9.
Vis-NIR spectroscopy was very sensitive to even low amounts of gluten in the samples, and the model will be able to detect amounts less than 20 mg/kilo of flour and is suitable for checking food safety.
A Result with Global Applications
The commercially available F-750 Produce Quality Meter, which was used to collect the spectral data, was found to be useful for rapid and precise detection of common UBF adulterants, wheat and maize. This was true whether the adulterants were present singly or combined. The PCA model can differentiate between pure and adulterated samples, while the PLSR models can correctly predict the amounts of adulterants. Suppliers, retailers, and food processors in the UBF supply chain can use this device to provide objective data on the quality of their products for consumers’ benefit.
Vis-NIR spectroscopy-based testing can help national and international agencies monitor and control UBF and its products. By 2023, the global market for banana flour is estimated to reach UDS 537 million and increase by 6.5% towards the end of 2027. This new gluten-free and resistant-starch-rich food can be produced from current harvests in tropical regions and improve the nutrition and livelihoods of even small farmers.
Related Products
- F-751 Grape Quality Meter
- Custom Model Building
- F-910 AccuStore
- F-751 Melon Quality Meter
- F-751 Kiwifruit Quality Meter
- F-750 Produce Quality Meter
- F-751 Avocado Quality Meter
- F-751 Mango Quality Meter
- F-9XXDK Dynamic Sampling Kit
- F-900 Portable Ethylene Analyzer
- F-950 Three Gas Analyzer
- F-920 Check It! Gas Analyzer
- F-960 Ripen It! Gas Analyzer
- F-940 Store It! Gas Analyzer
Most Popular Articles
- Spectrophotometry in 2023
- NIR Applications in Agriculture – Everything…
- The Importance of Food Quality Testing
- The 5 Most Important Parameters in Produce Quality Control
- Melon Fruit: Quality, Production & Physiology
- Fruit Respiration Impact on Fruit Quality
- Guide to Fresh Fruit Quality Control
- Liquid Spectrophotometry & Food Industry Applications
- Ethylene (C2H4) – Ripening, Crops & Agriculture
- Understanding Chemometrics for NIR Spectroscopy