Future-Proof Your Quality: How to Harness the Power of Spectroscopy in Commercial Agriculture – Part 2
Hunter Weber
February 15, 2023 at 6:47 pm | Updated February 15, 2023 at 6:47 pm | 25 min read
Request a Quote | Schedule a Consultation
Welcome to the second installment in our webinar series on spectroscopy in agriculture!
Subscribe to receive our monthly round-up of articles.
This 6-part series will cover the A-Z of internal quality assessment, spectroscopy, chemometrics, model building, model validation, and optimization in a commercial agriculture setting. In Part 2: Building a Model Part 1 – Sample Plan and Analytical Testing, Director of Applied Science Galen George will introduce spectroscopy, how it works, and its invaluable uses in commercial agriculture. Whether you are a beginner or an expert in the field, you will find this series informative and immediately useful.
Watch now to explore the following topics:
- The importance of a representative sample
- How to choose an appropriate sample size
- Importance of analytical testing
- Quality of equipment
- Repeatability, reproducibility, accuracy, and precision
- How each point above impacts model performance
A live Q&A session was hosted following the training.
Request a Quote:
Video Transcription
Introduction
All right. Hello, everybody. Good morning, if you’re on the West Coast like we are. Thank you all for attending today’s webinar. This is the second part in our multi-part series that is discussing how to future-proof your quality using NIR spectroscopy and specifically, the Felix Instruments F-751 and F-750 quality meters. This series today is part of the Building A Model sub-series. This is Part 1, in which we’ll discuss a sample plan and analytical testing. Before we get into the content of this webinar, I do have some light housekeeping that we need to discuss. First, today’s webinar moderator is Hunter, he is our marketing coordinator here at Felix Instruments. He will be monitoring the chat. So if you have any technical issues or anything, if I drop out for some reason due to Wi-Fi issues, please let us know if the audio cuts out and anything like that. If you’re having technical issues, please post those in the chat.
If you have questions regarding the content of this webinar, please use the Q&A function. That is what I will be reviewing at the end of the webinar today, and that’s how I will be able to access your questions. If you post your question into the chat I will not be able to see it and I will not be able to answer it for you. So please make sure you’re using the Q&A function. You can enter your question at any point during the webinar as the webinar goes through. And as you generate questions, just throw them into the Q&A function.
Speaker Introduction
So, in case you haven’t enjoyed one of our webinars before, my name is Galen. I am the Director of Applied Science here at Felix Instruments. I’ve been with the company for four years now. My background is in biochemistry and food science and I am an IFT-Certified Food Scientist, and previously worked in quality and safety assessment in the food, agriculture, and cannabis industries.

NIR Spectroscopy in Agriculture
So, the very first part of this webinar series, which we did a few weeks ago, covered the basics of NIR spectroscopy, what it is, and how our instruments function, talking about optical geometries, and just covering the background necessary to move further into the discussion about how this technology really works. And there is a process that we need to follow in order to go from having just a bare instrument with no model in it to having an instrument that can easily and rapidly perform non-destructive measurements — quantitative measurements — for internal quality attributes of your fruit. So it starts with sampling. From sampling, you do your spectra collection and analytical testing. From there, we use our multivariate data analysis, or kilometric toolbox, which we discussed last session. And then at the end of that, you’ll have a model that you can deploy onto an instrument and go out into the field, go into your lab, into your packhouse — wherever — and do instant non-destructive measurements of internal quality attributes. Things like dry matter, bricks, and titratable acidity. So that’s just getting us back to where we need to be to start this discussion today.
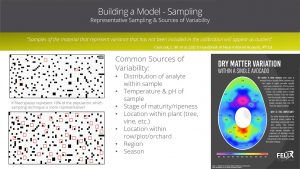
Now, today, we’re talking about sampling and analytical testing. I want to preface this by saying we’re giving you a 30,000-foot view. This is not meant to be a comprehensive course. This material could be, in and of itself, an entire college course, a semester course. So keep that in mind. We won’t have the time to cover every aspect of this but what I want to do is give you an idea of how to go about doing your sampling and your testing so that you can be successful, really, in building a model that you can deploy and be confident in that will give you accurate and repeatable predictions. So I wanted to start off this by talking about sampling. And there’s a great quote from a book that would be very useful for many people to read. It’s the Handbook of Near Infrared Analysis, the 4th edition, and the quote is, “Samples of the material that represent variance that have not been included in the calibration will appear as outliers.” Now, the reason I like this quote from that book is that this is a perfect example of why we need to make sure we have a representative sample within our model. Now, remember from the previous session, calibration, and model are used pretty much interchangeably. A calibration data set is what is used to build the model. So when you see those terms, you can think of them as equivalent.
Representative Sampling and Sources of Variability
Let’s talk about representative sampling. If you look at the images on the left, I pose a question, if the filled spaces — the darker spaces — represent 10% of the population — let’s consider the population everything in this entire box — then which sampling technique is more representative? In the first image here, we have someone taking three random samples and obtaining one random sample where the entirety of the box — the four squares — are filled. In one of them, only 25%, or a quarter of the boxes are filled, and in one of them, none are filled. The average of this would pan out to be something around 50%. Now, that isn’t very representative of the actual population, which, as stated, only 10% of the spaces are filled. Now, if we look at the sampling below, this, with a lot more samples, has now become a lot more representative. You see a lot of the squares have no filled boxes, some only have one, and one of them only has two. And so, that is a much more representative sample. And there are a couple of different ways we can ensure representation in our sampling, and we’ll get into that here in a little bit.
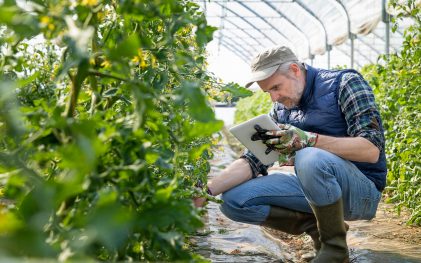
So just keep that in the back of your mind and let’s talk about what are the sources of variability that you’re going to encounter when you’re sampling, especially in the agricultural sector. Common sources of variability, and distribution of analytes within the sample. If you look at the image on the right, is a heat map of the distribution of dry matter within a single avocado. As you can see, at any given point in the flesh, there are going to be varying levels of dry matter. And so, where you actually take your sample from within the fruit to analyze, whether it be through classic methods or with an instrument like the F-751, that’s going to really make an impact on what your final results are for your model. If you only take samples from this area, say, the high dry matter area of the avocado, but you’re scanning with the instrument at a place where there’s low dry matter, then you’re going to see differences in your two results because you’re sampling from two different locations. So we have to counteract that when we’re thinking about sampling.
Another source of variability is going to be the temperature and the pH of the sample. Both of those have significant impacts on spectra, especially NIR spectra. And I’ll show you an example of that here in a second. When you’re doing your sampling, you want to make sure that you’re doing your scanning with your instrument as well as your analytical testing where your sample’s at the same temperature, same pH as it would be when you’re doing it in practice. If you’re out in the field, for example, and it’s a really hot day and you’re taking your sample scans, then what you’re going to want to do is make sure that when you go to do your analytical testing, the sample is at that same temperature as it was when you did your scanning.
Another source of variability is just the stage of maturity or ripeness. You can’t expect to only build a model with avocados that are at a certain stage of maturity, let’s say, late maturity right before harvest, and then expect that same model to work with avocados that are in the very early stages of maturity. This brings back that quote where if you have a sample of material that has not been included in the calibration, it will appear as an outlier. So if you don’t include fruit from across the entire stage of maturity and ripeness, then you aren’t going to be able to measure fruit across the entire stage of maturity and ripeness. You’ll only be able to measure fruit at the stage at which you used it in your calibration set.
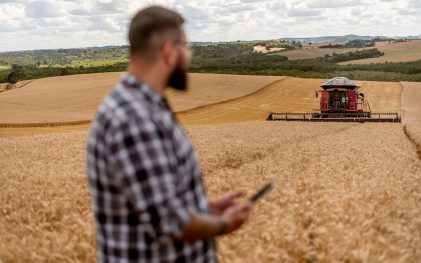
Another source of variability would be the location within the plant. There are papers, and journal articles, that have studied variations and certain types of fruit. And as far as their dry matter levels or Brix levels, acidity levels, color, and all those different quality parameters are concerned, they can all vary based on where the fruit is within the plant. So if it’s on a very sun-facing unprotected area of the tree versus a more internal part of the tree that’s highly protected, whether it’s higher or lower. And all those things can impact the actual internal quality attributes of the fruit, and so, they are sources of variability that need to be taken into account. Even the location within the row, the plot, and the orchard can cause variation. And the two really big ones on top of that, at a more macro level — what we just talked about was more on a micro level — on a macro level, when we’re building these global models, region and season are the two biggest influencers of variability. Trying to predict avocados that are grown in, let’s say, California with a model that was built only using avocados from Australia, that’s not going to work because they’re two completely different regions.
And then as far as seasonality is concerned, there are multiple ways that we can go about building seasonality into our model. But there are research articles out there that show that after about three seasons worth of data within your calibration set, then the fourth season that you go to use the instrument, it will predict fairly accurately and won’t require as robust of a yearly update as you would if you try to use a single season model to predict a second season. The more seasons you have built into your model, the more robust it’s going to be. And model robustness is the ultimate goal. Robustness being the ability of the model to predict datasets or data that is not built into the calibration dataset of the model.
Effects of Sample Temperature
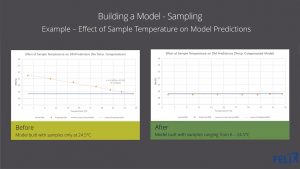
Representative sampling is obviously very important. I mentioned that I wanted to talk a little bit more about the temperature and how that affects the spectra and how that affects the model itself. I actually have some real-life data to show. This is an example of how sample temperature affects model predictions. On the left, we have a model that was built with samples that were only at room temperature, so 24.5 degrees Celsius. That was the only data included in the calibration data set. That model was then used to try to predict fruit that was at 6, 10, 14, 18, 20, 20.5, so, a whole range of sample temperatures. And as you can see, there’s a huge bias in prediction that gets smaller and smaller as we approach the actual calibration data set temperature, which is 24.5. Now, if we use a model that is built with samples that range from 6 to 24.5, and then we use that model to predict samples within that same temperature range, the predictions all have a consistent bias and they’re all very close to the actual dry matter value. So, as you can see, temperature does have a significant impact, and it’s not a constant impact. And that is why it is important to include temperature as a variable when you are building out your sample plan.

Choosing a Sample Size
Now, this might be the most asked question when people are considering building a model, how big of a sample size do I need? And I dislike that question for a number of reasons. Number one is that there is no one size fits all solution. Sampling is a very intricate process. At a base level, you can use something like a sample size calculator on the internet as a starting point. That’s a good starting point, just to see at what confidence level you set, you determine, based on your population size, how many samples would be needed to have a certain level of confidence about the results of the average value of that sample being representative of your entire population. Here as an example, the population size I put as a million. So if you have a million units in your population and you want to be 95% confident that the real mean value of your entire population is within plus or minus 5% of the measured results from your sample size, then you would need 385 samples. That’s a good starting point to have an idea of, based on what level of certainty you need to be at in your organization, how many samples you might need to build a model.
Now, this requires a lot of insight into your operation and what’s going on in your orchards or your fields. Understanding your sources of variability within your organization, within your field, your plots, and your entire operation is going to be the most crucial aspect of sample selection. Random sampling isn’t always the best option. What the best option is going to be to take a look at everything going on within your field, understanding differences in altitude, differences in fruit yields, your fruit count — how many fruits on average, or vegetables or whatever you’re measuring, how many on average are within the area that you wish to use your instrument — how many different fields you have — if you have an operation or you have multiple locations where you are growing your commodity. Just knowing and taking the time to try to understand all the different sources of variability that could impact your results is going to be a huge step in the right direction when determining your sample size and determining what fruit to sample in order to build the most robust model possible.
Now I know that’s an ideal scenario. And ultimately, the sample size is always going to be dictated by the cost, the amount of time, the amount of effort or personnel you have to dedicate to this process, and the equipment costs. If you don’t have the right equipment to perform the testing, then that’s an investment. But there’s a good happy medium that you can get to in order to ensure that the model that you’re going to deploy is going to be as robust as possible. Another good point, though, on this is that a large sample size doesn’t always mean a representative sample. If you think back to that first image with the large rectangle that had the darker and lighter squares, you could take a huge sample size and still not quite be representative, it’d be very easy to still be a biased sample. That’s why it’s important to understand all your sources of variability and take those into account when building out your sample. And as I’ve been stating, a representative sample set is going to guarantee you a robust model.
When you build in all the variables into your calibration data set, you’re going to end up with a model that can handle — anytime it encounters any of those variables, it’ll still be able to predict because it has seen those other variables in its calibration dataset. That is why this is so important, this idea of representative sampling. There are a lot of different ways to go about doing this. There is an entire college course, as I mentioned, worth of material to discuss sampling. There’s the theory of sampling. And you could take a highly statistical route with this if you want to. There are ways to calculate your exact rate sample size based on a lot of other factors, not just your confidence level and margin of error. However, as a top-down 30,000-foot view, this is a great start in just trying to come up with your own sampling plan starting off just by using a simple calculator and then taking into account all of your sources of variability. And then after that, take into account your resources, your time, effort, your money resources, essentially.
Benchmarking, Organization, SOPs, & More
So that’s the first part that we said we’re going to talk about today, the sampling. And sampling is arguably the most important first step to be able to take. But there’s a whole second half of this and that is the actual data acquisition, both the spectral and the analytical testing. And I wanted to talk about analytical testing because that is something that’s often overlooked when we are talking about building a robust model. Now, it might not contribute to as much error as core sampling, but it still contributes to a large amount of error in this process. There are a series of steps that I came up with that is a guide to a best practice for going about doing your analytical testing. Now, I understand this is still an ideal scenario, not everyone has the time or resources for this, however, this is what would be best practice in helping you to understand exactly what you should be expecting out of your model.
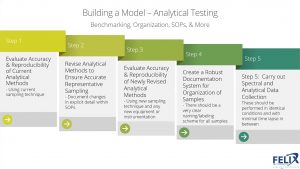
The first step in this would be to evaluate the accuracy and reproducibility of your current methods. Right now, every organization has a means of measuring some important quality attribute of the fruit, whether it be in the field to determine maturity and when to harvest or postharvest to determine quality before distributing that commodity. What you want to do is you want to set yourself a benchmark, so it’s a benchmarking step of knowing, based on our current sampling — your current sampling might be we just take five avocados from our orchard, just five random avocados, and throw them in a microwave. That’s just how you currently do things. But you want to make sure you know what your accuracy and reproducibility of doing those tests are. It’s a pretty simple process of just running that process through a couple of times and evaluating how accurate and reproducible those results are.
The next step of this would be then to take a step back and revise your analytical methods to ensure you’re being accurate and representative of your sample. And this is going to involve changing up your SOPs — standard operating procedures — documenting those changes in explicit detail. It’s going to involve doing a little bit of research and development. It’s part of understanding the variability within your process, within your orchard, and in your organization, and being able to take a step back and say, how can we improve what we’re doing currently and make it more representative of our total population? Once you do that, you can revise your methods. Then the next step would be, let’s go and, basically, perform the same as step one and evaluate the accuracy and reproducibility of these newly revised methods. Doing this, you’re going to want to be using your new sampling technique and any new equipment or instrumentation that you decided to go with, to ensure that you’re improving your process.
The next step in doing the analytical testing after that is going to be — this is prior to actually doing your data collection for your model building — creating a robust documentation system for organization of samples. There is a huge amount of error that occurs just because of a lack of clear naming and labeling schemes when you’re doing these kinds of model-building exercises. It is of the utmost importance to make sure ahead of time, before you even start, that everyone is on the same page when it comes to how you are naming things — your naming conventions — how you’re labeling fruit for analysis, etc. You want to make sure that, essentially, at the end of the day, you can easily align which measurement from your NIR spectroscopy instrument, like the F-751, which measurement from that instrument can be aligned with which analytical measurement that you performed in the laboratory or in the field with a destructive technique. As long as you can align all of those, you’re in the clear. But if there’s one misalignment where something wasn’t written down correctly and you have a mismatch, and it mismatches everything from then on in your entire list of data that you collected in your entire sample, then that’s going to render your whole model useless and it’s going to render that whole process a big waste of time and money, which is not what anyone wants. So this is a very important step in the process of doing your analytical testing.
The next step after that is to go through with your spectral and analytical data collection. This is collecting both your spectral data using your instrument like the F-751 or the F-750 and then taking that fruit or vegetable or whatever you’re measuring and putting it through the analytical testing process afterward. Now, as I already mentioned about temperature, pH, and other variables about the sample, you need to do your best to ensure that you’re performing these two different data collections at identical conditions. And you want to have minimal time lapse in between because these are living evolving systems. Once you remove a fruit from a tree changes are going to start happening internally to that fruit. And the longer you wait in between taking a scan and doing an analytical test, the more difference there’s going to be in any of the analytes really, that you’re going to be measuring. That’s just introducing variability when you don’t need to be introducing variability. So you want to make sure that you’re minimizing the time lapse between the two data collections.

Choosing a Methodology & Equipment
That’s just an overall 30,000-foot view process that you can undertake to ensure a successful analytical testing process when you go to build your model. Now, in regards to equipment, this is even less of a factor — as far as error is concerned — than your process, making sure your actual testing and sampling are correct and representative. However, this still can influence the end model. Because, at the end of the day, all these technologies are not necessarily equivalent.
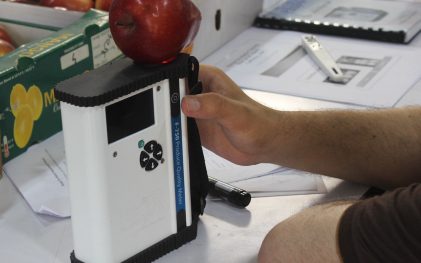
On the left side of the screen, there are three different types of instrumentation for doing Brix measurements. We have optical refractometers, pocket digital refractometers, and laboratory-grade refractometers. Now, as you can imagine, optical refractometers require a lot of expertise to use, and experience, and can easily be biased from one operator to another. You can eliminate that by moving to something like a digital pocket refractometer that you can use out in the field. However, these can be prone to errors. They aren’t as finely tuned. They’re more robust for field work but they might not have temperature correction in them. So, temperature has a huge impact on the refractive index of liquids. You have to keep that in mind, that if you’re measuring fruit juice at a super low temperature or a super high temperature, and that’s at a different temperature than what you — and it’s not compensating for that temperature or that’s at a different temperature than when you did your actual scanning with the NIR device, you’re going to have issues there. And so, you want to make sure that your Brix device is capable of doing things like correcting for temperature. And that’s where you get into the realm of these laboratory-grade devices. I know that Anton Paar has a lot of higher level, higher grade refractive index refractometers. And they even have one that can filter out the pulp from any fruit juices and allow for a more accurate refractive index or Brix reading.
There’s also, on the other hand, our dry matter measurement. Let’s do avocado, for example, because right now across the world there are many different ways that people are measuring avocado dry matter. There are a lot of different sampling techniques that people are using of the flesh itself, a lot of different methodologies. A lot of people use the microwave to do their drying so it’s more rapid, however, a lot more prone to burning and a lot easier to, I guess, mess up, for lack of a better term. There’s dehydration, using just a grocery-store at-home-grade dehydrator, which is a very popular option as well. It takes a lot more time and temperature control might not be as great. If you’re stacking those layers too high and you’re not monitoring the temperature correctly, then you have no idea what temperature you’re drying these fruits or these samples at.
Then there’s something like a forced air oven, which you can monitor the temperature with the display, with thermistors or other probes that you can put in there to monitor temperature. A much more controlled environment and a lot more accurate at the end of the day when you’re performing your testing. But again, like with the Anton Paar laboratory grade refractometers, a more expensive route. What you need to do is if you are not going to be able to invest in higher-grade equipment to do this testing, you need to invest in doing some sort of quality control and active monitoring to ensure that the equipment is performing how it’s supposed to be. At the very minimum, you should be doing that. So it’s really still going to come down to money. But at the end of the day, it’s always going to be a better option to use higher-quality equipment to perform your analytical testing.
Additional Literature
I wanted to provide some additional literature because a lot of this information, as I mentioned, can go much deeper to learn even more about how other people are implementing these different sampling techniques, how other people have studied, and how location or season, or region can affect models. There are a lot of good publications out there. As I mentioned, and as I already pulled a quote out from the Handbook of Near-Infrared Analysis, is an excellent textbook that has a wealth of information about everything you could ever need to know about near-infrared analysis. And if you’re really interested in learning more and doing this process right, I would highly recommend that textbook, as well as any publications you see from Kerry Walsh, who has been using this technology in the field for a very long time, was one of the first pioneers really implementing this on a commercial level. There’s a really great review from Kerry, as well as Nick Anderson, about the evolution of chemometrics with near-infrared spectroscopy for free quality evaluation. I highly recommend checking that publication out, as well as some others regarding, as I mentioned, location, season, tree age even, for this publication here too, and how those influence NIR models and calibrations.
What’s Next in This Series
So that was just a really general overview. That’s what this series is meant to be just to instill the ideas of how we should be going about doing these model-building processes in order to give us a robust model that, at the end of the day, we feel confident in the results we’re getting and, at the end of the day, we can feel good about implementing it across our organization increasing our data collection, increasing our data availability, and reducing costs at the same time. That’s what the benefit of this technology is. But we have to do the due diligence to ensure we’re doing the model-building aspect of this correctly. This has been Part 2 in which we talked about sampling and analytical testing.
The next part is going to be more about spectral data, so spectral pre-processing, types of modeling, and wavelength selection. So, a little more on the side of multivariate data analysis, which comes after the data collection, the sampling, and the analytical testing. That’s the next part of the series. After that, we will talk about model validation, and model validation is a crucial step in ensuring that our model is as robust as we need it to be. We’ll talk about different types of validation testing and statistics. Then we’ll talk in Part 5 about challenges that we encounter when trying to transfer a model from one device to another, a problem that we call calibration transfer. And at the very end, at the conclusion of this series, we’ll talk about how to maintain your model, how to optimize your model, and tips and tricks for utilizing these kinds of instruments out in the field. And that will conclude our entire series on NIR and chemometrics, and how to future-proof your quality.
Closeout
If you are interested in any of the devices that we offer, if you work in avocados, kiwifruit, mango, melon, or anything of that nature, or if you are just simply interested in the devices and the pricing, please follow the link that Hunter will post in the chat — since you aren’t going to be able to click this one here — and that will take you to a landing page that will allow you to fill out a form for pricing and additional information about the instruments. You can follow us on social media — Facebook, Twitter, as well as LinkedIn. If you want to get more up-to-date news about new products we’re working on or new developments, updates to software, or anything like that, that’s where we’ll be posting stuff, as well as on our website. We have a new website if you want to check that out, there’s a lot of good information there. You can always call us as well to get information. And if you happen to be in the area, let us know and maybe we can arrange a site visit, if you’re ever in Camas, Washington.
Live Q&A
Thank you, everyone, for joining us today. I will now go to the Q&A section and answer the questions that we have in the Q&A. The first question from Daniel is: “When will the next webinar be, and will participants of this webinar be informed via email?” We have not yet set the date for the next webinar. I am traveling for work pretty extensively over the next month, so it’ll likely be in mid-March, I would say, my best guess. And the question after that is: “Will participants of this webinar be informed via email?” I don’t know the answer to that for sure but I’m guessing it’s yes. Because we do like to send out emails to everyone when we ever have a new webinar coming up, so you should be notified when we do have the next part of the series.
And the next question is from Kendra: “If I want to make a model for a new commodity what is the minimum amount of scans I should take on a single fruit?” That’s a great question. The minimum amount of scans question is kind of similar to asking what is my minimum sample size, however, there’s a little bit of a caveat. With scans of an instrument, with spectra, the more you can average, the better your spectra is going to be. The more scans you can average together to create a single spectra is going to be better. So that’s one part, and then it really depends on the variability of the distribution of your analyte within the fruit. If you’re concerned that you are not getting a holistic view of the entire fruit, then you should take multiple scans of different parts of the fruit. If you are concerned that, for some reason, one scan site is not representative of the entire fruit, then yes, you should take multiple scans. But that requires insight into your commodity, so it really depends on the commodity. For example, kiwifruit doesn’t really require more than one scan. But if you want to take three scans at the same location and average those together, you’re always going to get a better result than if you only take a single scan. So, the more you average it is going to improve things but also there’s a time cost. So it really is up to the person who’s building the model what they want out of their model. Excellent question, Kendra. Thank you.
Next is from Dr. Osuna, Dr. Jorge Osuna: “Congratulations, Galen. Excellent. Very clear presentation.” Dr. Osuna, thank you so much, and I hope that we get to see you soon.
The next is from Andrey: “If you already have a model for an apple cultivar, what would it take to adapt that for a different one, i.e. with a different skin color?” Adapting a model, there are a couple of different things you can do. One, you can attempt to tailor or train a new model that includes both cultivars and you can see what the results are from validation of that, or you can just build a second model for that new cultivar. There are advantages and disadvantages to both methods. An advantage would be that you have a model that is now more specified to each specific cultivar. The disadvantages, in the instrument you wouldn’t be able to just scan one cultivar and then scan the next one, you would have to switch between your models on the device, as well as, if you build a single model with both, in contrast with a single model, you’ll be able to just scan whatever of each cultivar and get a result. It really is up to you, but all it takes is just adding in more data that encompasses as much variability with that new cultivar as possible. So you can either add it to your current model or just create a new one. That was a great question.
Next question from Jorge: “How many different stages of maturity of a certain fruit should be taken into account for building a model for that commodity?” Jorge, that is completely dependent on how you want to utilize the instrument at the end of the day. If you want to utilize this instrument in a capacity where it’s out in the field, monitoring fruit from very early maturity all the way past harvest, then you’re going to need to build in all of that variability. You need to take scans and analytical samples from early maturity and then at every stage in between up until the end of your maturity, past harvests even. It’s up to how you want to utilize it and up to your operation. You have to build in the variability that you expect to encounter when you are deploying that model and using it in a real-life scenario. You have to think ahead of time, what are we going to use this for, and what do we want to use it for, and then use that to help guide how you’re going to create your sample for your calibration set.
The next question from Gerald is: “You mentioned larger variations of the analyte are possible within the fruit, for example, avocado for a good calibration. Will you focus on the final setting of the scan, i.e. non-destructive from the outside through the skin, and take the whole fruit for dry matter analysis? Can that give a good model at all? Do you know other examples — kiwi, melon? Should you measure one spot of the cut fruit and take exactly this spot for dry matter content? I guess you end up with a very good model but not really applicable in practice.” So this is the balance. This is actually a very good question, Gerald, thank you for bringing this up. As I mentioned in the first section of this series, the light from the F-751 penetrates, kind of like a cone, into the fruit and it’s only taking a sample from where that lens is on the device. So it is only getting an idea of what’s happening in that specific location of the fruit. Now, the workaround for this is, if you don’t want to have to, as Kendra mentioned, take multiple scans all over the fruit in order to get an idea of what’s happening in the whole fruit, there are ways, if you understand the physiology of your fruit, to — I guess for lack of a better term — game the system. For avocados for instance, if you look at the equatorial part of the fruit and on the dorsal and ventral side, if you average those two sides — if you take a sample with the F-751 on both sides so it’s getting a conical cross-section of both the equatorial dorsal and equatorial ventral side of the fruit — the average of that dry matter is typically an exact representation of if you took the entirety of the flesh of that avocado, threw it into an oven, and dried it. If you understand your fruit, a way to get around having to do scans all over the fruit is to understand what subsamples to take in order to represent the population of that whole fruit. So it’s sampling on an even further micro level. It’s subsampling. Like doing a composite sample. What subsamples of this larger fruit can I take that will be a representative sample of the entire flesh of this fruit? For avocado, we’ve determined that the dorsal equator and the ventral equator, having the average of those two subsamples, is a good representation of the whole fruit. Now, for other fruits, it’s not as complex. For one, kiwifruit, it’s a much more transparent fruit or translucent fruit with a much thinner skin — and a very regular skin — much easier for the light to penetrate into the flesh and more of the flesh. So you’re not having to do much subsampling when you’re doing a scan with the device. With kiwifruit, typically there is a cross-section cut out from the middle that is used for the dry matter. Then a Brix is squeezed typically from the blossom end of the half of the kiwifruit after its cut for dry matter. That has been the practice of the growers in New Zealand with Zespri. They have done their own studies to ensure that that is an accurate representation of the entirety of the fruit. For other fruits, it’s more complicated. Melon does require multiple scans on the fruit itself because there is heterogeneous distribution of Brix. It’s a very large fruit so you need more composite, a bare composite of subsamples. And the Brix develops from the inside of the fruit outwards so there is also that as well that can pose problems when we’re trying to be representative. It requires more scans than normal. But what it really takes is, as I mentioned, the understanding of variability and knowing your fruit that you’re supposed to be measuring, even potentially performing the studies yourself to ensure that the subsamples you’re taking with the instrument, that those sections of fruit are representative of the entirety of the flesh of the fruit. But when you are doing your actual analytical testing with the F-751 specifically, you need to be taking your core samples from where the scan is taken. You can’t take a scan of an avocado at the equator on the dorsal side and then take a random sample of flesh from the neck on the ventral side and expect those two things to correlate, because that’s not what we sampled with the device. So you always need to make sure that what you sample with the device is what is tested analytically. That was a really good question, Gerald. Thank you very much for that. I’m glad I had the opportunity to talk more about that.
It looks like that’s the end of our questions. Oh, one more: “Can you combine data from a Minolta colorimeter with F-750?” Absolutely, you can. Many people have before. Both internal and external color. We have studies done on multiple commodities with both. And if you want, you can just simply look up on Google Scholar or wherever you can look up F-750 internal color or external color and you’ll find some studies that have been done.
All right, and that’s the last question. We’re going to close off the questions. And if you do have any questions that weren’t answered, or that you come up with later, feel free to reach out to us, we’re happy to answer any questions you have. The next part of the series, as was asked, we will notify everyone when the next series is announced. Thank you all very much for attending today. I appreciate the time that you all took to learn more about this. It’s a very complex process, but it’s worth understanding so that these devices can provide the value that you should get out of them. They very much will improve your overall data availability, data amount, as well as reduce costs by being a non-destructive technique, being faster than your traditional testing. So it’s important that we do this correctly in order to make sure that they provide that value for you. All right, thank you all very much, and have a great day.
Related Products
Most Popular Articles
- Spectrophotometry in 2023
- NIR Applications in Agriculture – Everything…
- The Importance of Food Quality Testing
- The 5 Most Important Parameters in Produce Quality Control
- Melon Fruit: Quality, Production & Physiology
- Fruit Respiration Impact on Fruit Quality
- Guide to Fresh Fruit Quality Control
- Liquid Spectrophotometry & Food Industry Applications
- Ethylene (C2H4) – Ripening, Crops & Agriculture
- Understanding Chemometrics for NIR Spectroscopy