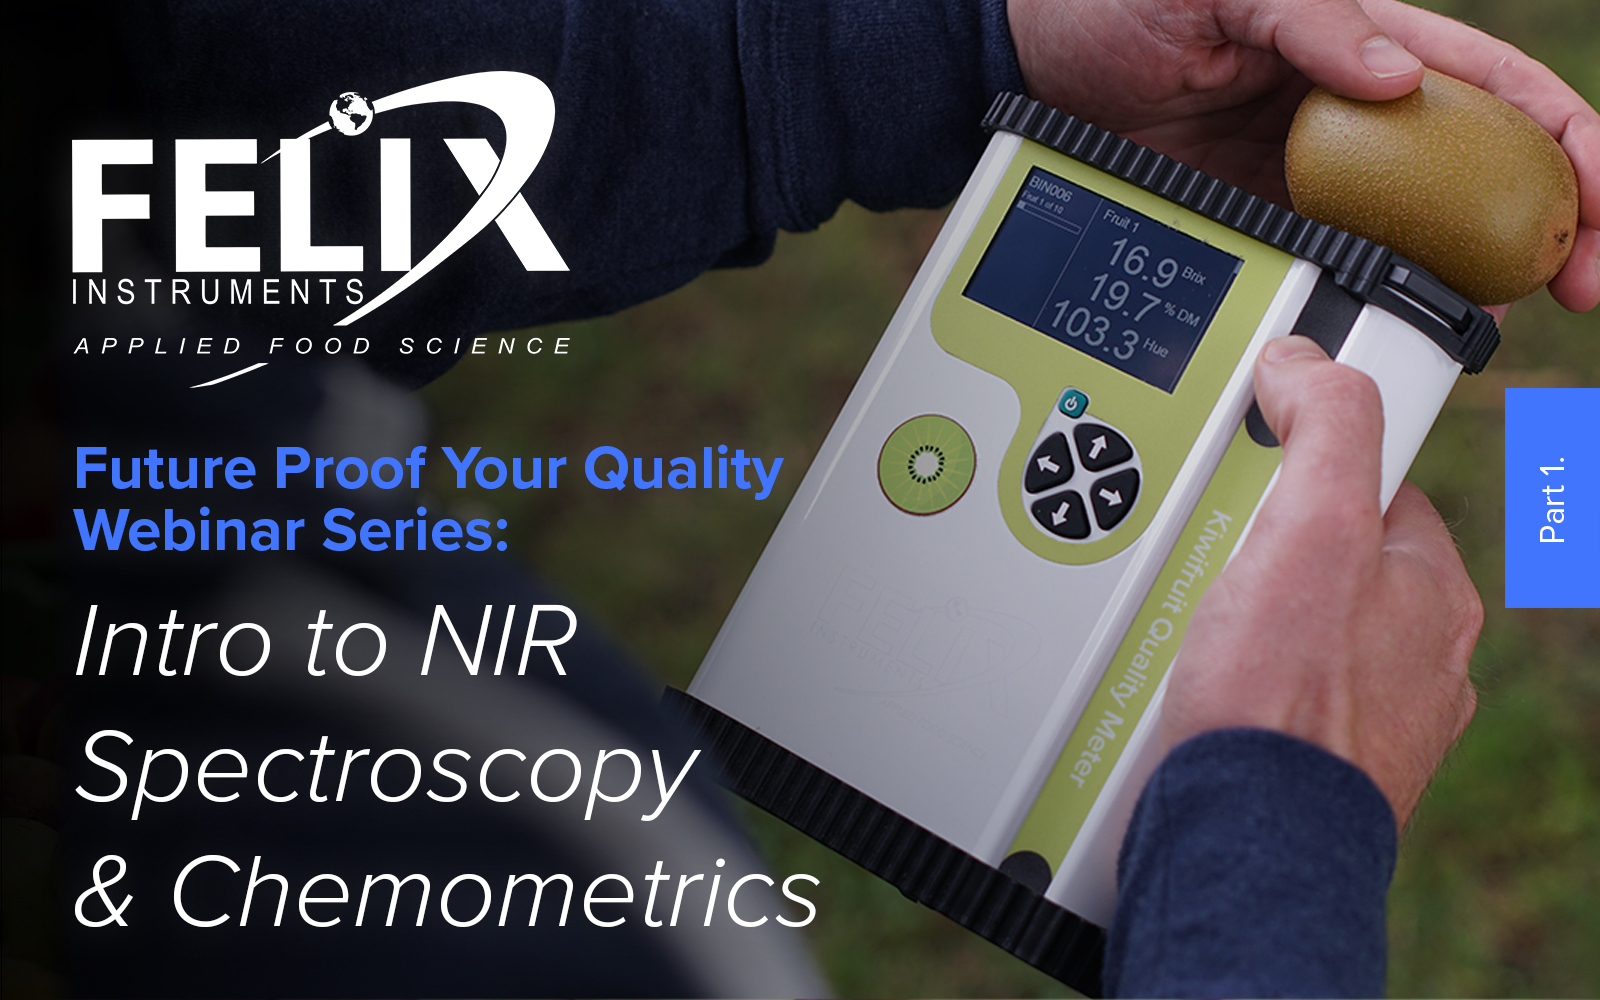
Future-Proof Your Quality: How to Harness the Power of Spectroscopy in Commercial Agriculture – Part 1
Hunter Weber
January 18, 2023 at 6:43 pm | Updated January 18, 2023 at 6:43 pm | 30 min read
Request a Quote | Schedule a Consultation
Welcome to the first installment in our webinar series on spectroscopy in agriculture!
Subscribe to receive our monthly round-up of articles.
This 6-part series will cover the A-Z of internal quality assessment, spectroscopy, chemometrics, model building, model validation, and optimization in a commercial agriculture setting. In Part 1: Intro to NIR Spectroscopy and Chemometrics, Director of Applied Science Galen George will introduce spectroscopy, how it works, and its invaluable uses in commercial agriculture. Whether you are a beginner or an expert in the field, you will find this series informative and immediately useful.
Watch now to explore the following topics:
– What is spectroscopy, and what are its applications in agriculture?
– What are the different types of spectroscopic equipment and
where in the growing/packing processes are they used?
– How do our spectroscopic devices work?
– What is chemometrics, and why is it relevant?
A live Q&A session was hosted following the training.
Request a Quote:
Video Transcription
All right, it is time to get started with the webinar. Good morning, everyone from the Pacific Northwest. Hello, and welcome to our first installment of our multi-part series on NIR spectroscopy. This segment today is going to be more of an overview of the technology itself, and then a little bit about who uses it, the different types of instruments there are and how the technology itself works, and then I will explain what the next parts of this series are. So be sure to stay tuned to the end of the webinar. Some light housekeeping really quick before we get started. Our Distributor Manager, Suzy Truitt, is our host today and she is managing the chat function. Anytime we have extra information we want to provide to you we will post that in the chat.
If you have any questions pertaining to the content of this webinar, please put that in the Q&A function in Zoom, not the chat. All questions, please go into the Q&A so that at the end of the webinar today I can open that Q&A function, and I can look through and answer all your questions one at a time. If they go into the chat, I will likely not see them. But Suzy will do her best also, to make sure that if there are any questions accidentally put into the chat, they will go into the Q&A. If you are encountering any technical difficulties where you can’t hear me, if my presentation is glitching, or if something’s going wrong on a technical side, please do put that in the chat so you can inform us that something’s not working correctly, you can’t hear me. If you are unable to see me or see the presentation, please let us know and we’ll make sure to address that before we continue.
Speaker Introduction
All right. Just a quick introduction of myself. My name is Galen. I am the Director of Applied Science here at Felix Instruments. I’ve been with the company for four years now. My background is in biochemistry and food science. I previously worked in quality and safety assessment in the food, agriculture, and cannabis industries. And so I’m really excited to talk to you today about this technology because I’ve had a lot of experience now with it and used it in multiple different settings. And so I hope that this can provide you with some great insight into how this technology can be used. So let’s just go ahead and start off.
What is near-infrared spectroscopy, or NIR spectroscopy?
Sometimes also referred to as NIRS, as an abbreviation. From a 30,000-foot view, NIR spectroscopy is shining a light source onto a sample and then receiving back information into a detector that then allows us to acquire what we call a spectra. Now, there’s a lot more nuance to that. What we’ll do now is I’ll talk to you a little bit about — not get into the actual physical chemistry involved in what’s happening, but maybe a little bit more detail so that you can kind of understand exactly why it’s a useful tool.
When we’re talking about NIR light, we’re talking about light in the electromagnetic spectrum that’s just out of visible range. It’s typically between about 780-2500 nm, as far as wavelength is concerned. And so in those wavelengths of light, what’s happening is we’re shining light into a sample, in this case. If we’re talking about commercial agriculture, then we’re talking about some kind of produce or grains or whatever it may be that you’re growing in your fields, and we’re basically shooting lights into that. There are multiple ways that we can go about doing this. We can be looking at, as you can see in this optical geometries infographic here, there are a couple of different methods of looking at the light and seeing what’s happening.
There’s specular reflection, which is just a direct reflection off the surface of whatever we’re measuring. And that doesn’t really give us a ton of information that we really care that much about. In some cases, you might, but in a lot of cases, that doesn’t give us the amount of information that we’re looking for. Then there’s diffuse reflection, which is something that is a little more useful, I would say, for looking at things like internal quality attributes. There’s partial transmission, or what we call interaction. And then there’s also full transmission. Transmission would require you to have a light source on one side of the fruit, or whatever you’re measuring, and then a detector on the other side with the expectation that you are going to get some transmittance of light in the infrared spectra going all the way through that sample. In a lot of cases, that’s a pretty lofty goal, especially if you have something like a deciduous fruit that has a pit or a stone fruit, or an avocado. That can be a pretty hopeful goal to have something go all the way through, something that dense and that thick.
Anyways, there are lots of different ways to measure this light. But what’s actually happening on a more fundamental level, and what gives us the information that we want is — the absorption of this light energy at different wavelengths is caused by different strengths of different types of bonds. Now, NIR spectroscopy is more of a hydrogen-bond-dominated technology. And so, the bonds that we’re looking at, these chemical bonds that we’re looking at are things like O-H bonds, C-H bonds, and N-H bonds. And now, each of these has different levels of strength and so they require different levels of energy to activate them and absorb that energy. When that’s happening, what we’re seeing is different areas of this wavelength spectrum from 780-2500 nm, different areas where different bonds of different strengths are absorbing energy. That’s what gives us the kind of information that we need to identify specific chemical constituents.
Now, there is a little more nuance to that in that in the shortwave NIR spectra, we’re not actually looking at the fundamental vibrations of these bonds, we’re not looking at the actual fundamental identification of each of these individual bonds. We’re actually looking at what we call overtone bands and combination bands that are like harmonics. Like, if you’re thinking about frequency and music, definitely like harmonics of the initial fundamental vibration, which lies in the mid-infrared region. But what we get out of the NIR is, even though it’s a little more, I guess, muddled, it’s not as clear and concise as those fundamental vibrations that we get in the mid-infrared. What we get is some kinds of overlaps and combinations and these absorptions at wavelengths where certain bonds might overlap. And so, what we get out of it is a spectra and we get a — there’s an example on the bottom right of a reflection spectra of different types of avocado and mango. And with this information, we can glean what kinds of chemical bonds are in the sample that we’re looking at. And so with that information, you can then imagine, well, if I know what kinds of chemical bonds are in here, I know what kinds of chemicals some of those might be associated with, such as sugars, or water, or different amino acids or proteins or fat. Or even other micronutrients. So, the technology itself, in a hardware sense, is shooting light and some kind of optical geometry, light in the near-infrared, with some kind of optical geometry setup so that it can give us a spectral reading that is showing us absorption in reverse reflection levels of different chemical bonds. And typically, those bonds are C-H, O-H, or N-H bonds.
Chemometrics
Now, that is all well and good. We can get the spectra out of it but that doesn’t necessarily help anyone in the commercial agriculture sector. That’s all it’s doing, is giving you a spectra. What do you do with that spectra? There’s nothing necessarily that you can do besides maybe classify samples with that. So, what if you want to use it for something like quality control, or if you want to use this technology for something like phenotyping in the field or something like that? The question is, how do we go from acquiring that spectra to getting quantitative predictions of certain analytes or even just creating classification models? And so the answer to that is we’re going to use the discipline called chemometrics. And chemometrics embodies a lot of different things. It’s essentially just combining mathematics and statistical analysis and all sorts of other computer science and other types of data analysis in order to give us more information about chemical constituents.
And one of the biggest parts of chemometrics that we’re going to focus more on here is multivariate data analysis. And that is the actual process, we’re going to go through to take the data, which is our spectra — all of these different spectra containing dozens and dozens and dozens of different information about different wavelengths — and we are going to take that and create an actual model that then is predicting the actual analyte level of whatever target analyte you’re looking at. In apples, for instance, what we’re doing is we’re combining data from the spectra with an actual reference measurement — something that you’re already doing in the laboratory as a destructive means of measurement — and we’re combining those two together to create an actual model. And this is also called a calibration. You’ll hear those terms interchanged a lot, model and calibration. Calibration, you’ll find a lot in older literature and models is more, I guess, like a kind of modern data science term. But they’re interchangeable terms.
And so, with this multivariate data analysis, there are a lot of routes we can take. We’re not going to get really deep into this today, there’s going to be a section of this webinar series where we’ll get more into multivariate data analysis and types of models. But you can create quantitative or non-quantitative, more qualitative models for either classification or quantification of analytes. And that’s how we’re going to do it. And so now what we’ve done is we’ve got this technology, NIR spectroscopy, we’ve combined it with the powerful multivariate data analysis from our chemometrics discipline, and now what we have is a technology that we can send light into a sample and at the end what we’re getting, instead of just spectra, what we’re actually getting is a numerical value for a certain analyte.
Devices in agriculture
With this technology in mind, knowing that this is where we’re at, we know that we need to combine these two things. What kind of devices are out there and who’s using them and where are they mostly utilized? In the commercial agriculture sector specifically, we’ve got really three main sources of NIR spectroscopy. We have benchtop sensors, which are typically used in things like quality laboratories. These are very common because they’re the original invention of NIR spectroscopy, a benchtop laboratory setup. Benchtop sensors, typically used in labs, usually come with their own calibrations for specific commodities, or specific analytes within a certain commodity. Those are commonly just mostly used in laboratories.
We have inline sensors, which are typically high-throughput. They are typically not as high of resolution or accuracy as benchtop sensors or portable sensors but they are very high-throughput. They can work in a sorting line to help classify certain types of, let’s say, avocados, for dry matter or even for sorting something by color. We have inline NIR sensors that work in that capacity.
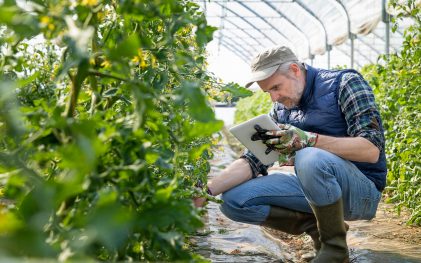
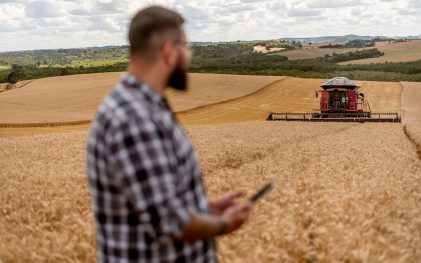
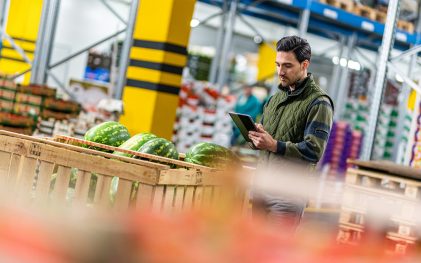
Then we have portable sensors, which is what we’re going to mostly focus on for this webinar series. These are used at a lot of different places throughout the supply chain. We’ve got people that want to use them in the field for harvest monitoring, people that want to use them in a post-harvest setting, whether it be receiving incoming lots or in pack houses when they’re checking for quality, or even so far as importers and retail outlets. There are lots of different places in laboratories as well that maybe don’t want to invest in the expense of a benchtop sensor, the portable sensors are usually a more affordable option. They also can be used in settings where inline sensors are used to help with calibrating inline sensors.
The reason this is a Venn diagram and not three separate points is because these all live in intersection with one another. They don’t necessarily exist apart, they all coexist together. And they can work well together, especially portable sensors with inline sensors, and benchtop sensors supporting inline sensors. If you need to do a further quality check on something that was giving a weird reading with another sensor, you use it as a backup. They don’t necessarily have to exist as separate, they can be used together in that sense.
Benefits of portable sensors
With the quality sensors that are portable, which is what we’re going to focus on, there are quite a few benefits. One being, they’re non-destructive technologies. Originally, whatever you were doing the test for, a specific analyte was destructive, either wet lab method or using some other technology that is also destructive. Portable sensors are also very accurate, especially now that we are having such large advances in the multivariate data analysis area. With all these new chemometric, model-building techniques, we can increase accuracy and robustness quite a bit, as well as the ongoing advancements in spectrometers themselves. The spectrometer gets smaller and higher resolution, we’re only increasing the accuracy of the sensors.
These are versatile instruments. The portable aspect of it is one of the key aspects of this in that it can be used pretty much wherever you want to use it. You just take it with you and it can be used at that location. And then the other thing that’s really key, that is often overlooked with this technology, I think, is the fact that you can collect significantly more data to more accurately inform key decisions at critical time points. Something I’m going to talk about in one of the next sections of this webinar series is coming up with sampling plans. In a lot of industries right now, when we’re sampling, we’re thinking about how much we have to destroy and the cost of sampling. Well, when you’re doing it in a non-destructive way, the only cost is the amount of time that you have to put into it. If you’re getting measurements in seconds, and they’re all non-destructive, you can collect significantly more data to more accurately inform you about the quality of your product. And so, building these larger databases, and big data, that’s the future of where we’re going with Ag. Being able to collect that much data without having to destroy hundreds of samples and have the laboratory personnel and equipment needed for such a high throughput operation is an invaluable asset.
Portable NIR quality sensors
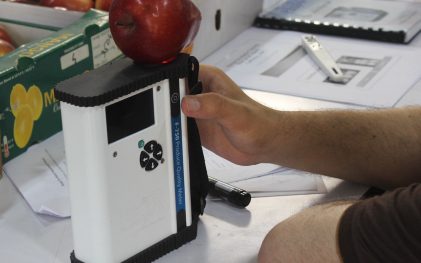
The reason we’re focusing on portable quality sensors is because at Felix Instruments, that’s what we are focused on. We have a line of different quality meters that are commodity-specific, as well as a more research-based unit that’s just an open-ended unit that is for people that want to build their own models, and their own calibrations. But the other ones, the ones that are commodity-specific, come with built-in calibrations so that it is just a point-and-click instrument where you take into the field, or wherever you are, and you want to assess dry matter and avocados, or dry matter and brix, and kiwi fruit and mangoes, then that is something that you can do with our sensors.
What we’re going to do with this webinar series, moving into the future, with these next sections, is we’re going to be talking specifically about multivariate data analysis and model calibration, validation, and deployment, but always giving you a direction of it that is how we do things at our facility and how things integrate, how those concepts integrate with our technology.
Who is using NIR spectroscopy devices?
So, who’s using these devices? I already mentioned that people in the field or different points in the supply chain are using this technology. But there are a lot of applications out there that are maybe not necessarily what you might think. Obviously, researchers and academics that are just looking into this technology and how it can be utilized better in the industry are using these portable sensors. We have quality lab personnel, so people that are just doing quality checks, whether it be regulated quality checks or just an in-house quality lab. Packers and distributors, people that are really concerned about the quality of produce that is going out, then they are also going to be checking that on a regular level. At those regular intervals, instead of destroying the fruit, they can just check it and then pack it and send it on its way. Horticulturists and agronomists, people that are doing in-field studies, rapid phenotyping, and R&D and that nature, are all also utilizing these portable sensors. And then another sector that’s really grown as of late are AgTech innovators, people that look at things like new coatings for fruits and vegetables to extend shelf life, or new packaging innovations to extend shelf life. They’re utilizing this technology so that they can assess the efficacy of their technology. It’s using one technology to validate another technology, which is really awesome and great to see in the industry.
How do the devices work?
Since we’re talking about the Felix Instrument line, I’ll just let you guys know how exactly on the hardware end — I explained, in general, how NIR spectroscopy works in the beginning of this presentation — how the 750 works is, on an interactance optical geometry. I mentioned those different optical geometries that could be used — reflectance, diffuse reflectance, interactions — and so I wanted to make sure that you guys were aware of exactly how this tech-specific technology is working. We’re using a xenon lamp light source and we’re using light interactance optical geometry to obtain our spectral information from approximately 310-1100nm. So what we’re doing is visible into the near-infrared. But we’re not into the full near-infrared spectra, we don’t go all the way to 2500. We’re just 310-1100nm.
When you are obtaining that spectra, the instrument is not only storing that raw spectral information on the SD card, it is also then taking that spectra, running it through the calibration that we’ve created that’s on the device, through our multivariate data analysis, we’re running it through that calibration, and then spitting out a quantitative prediction on the screen. It is just a point-and-click. You get the raw spectral data as well as a prediction value. We are big believers in big data and utilizing data as much as possible, so we want to make sure that we’re not just only giving you a prediction, but that we do have the spectra available to use if we need to use it for something. And that’s going to come into play in an upcoming webinar when we talk about model development and model validation.
So, that’s how the F-750 works. As you can see, here’s a diagram of the internals. If you already own one and you have never had the opportunity to take one apart yourself or see what’s inside, this is the setup and this is how the internal operation of the instrument works. We have our control board, and our storage card up here, and the lens where the fruit sits is up top here. We have our light tube, fiber optic cables here with our spectrometer, and our lamps here. We have a built-in reference shutter, as you guys are all aware so we don’t have to do any sort of reference scanning prior to doing our sample scans. All of that is built into one instrument.
AppBuilder
Now, you’re probably wondering how we go about getting that calibration onto the device and how we develop them. This is something that we’ll also be including in later sections of the webinar. This is our software that we built in-house. Our lead engineer for this has worked a lot to build an intuitive software for building models that is optimized for the 750 and 751. And we have tutorial videos as well as webinars, previously. If you’re interested in learning more about how this app builder software works, it is built to easily allow import of the spectra files from the device.
As I mentioned, we are acquiring spectra data files every time we take a scan with those devices. You can easily import those and it’ll import all the information necessary for that file, including things like metadata, organizational things like your lot, and all that stuff to keep your data well organized, which is of paramount importance when you’re building models. And while it is optimized for 750 and 751 data file types, there is the possibility of using this for non-750 and 751 spectra data. If that’s something that you are interested in, please get in touch with me outside of this webinar and we can discuss that.
But in general, what we do is we utilize this not just for the model building, but for also looking at things like model performance and for optimizing our models, for looking at outliers, for trying out different chemometric techniques. We don’t just have PLS, which is the traditional regression model type but we also now are using neural networks, which are more powerful and more robust when it comes to some of the challenges associated with spectroscopy that we’ll talk about in further sections or installments of this webinar series.
And, the nice thing about this software as well, is that its open access. So if you have a little bit of experience using low code — you don’t necessarily have to be a seasoned computer science professional but you have some ability to understand computer logic — then there is the ability to customize things about either the display of the instrument or how things are calculated, what spectra you’re using, whether it be raw absorbance, first derivative, second derivative, other pre-treatments of data. Or, if you do have a seasoned computer scientist on staff, you can do things like add in new types of model buildings. Like, if you want to try convolutional neural networks or some other AI model building, then you can add those packages in as scripts and just use those in this software. So, it’s a really intuitive way for us to build these models. And we’ll get more into the actual process in later sections, but this is how we create the calibrations that go into the F-750s and the F-750s so that the user can simply press the Scan button and get an actual quantitative prediction on the other end.
What to expect in the future of this series
Coming up, I just want to give you guys an overview of what is to be expected from this webinar series. Today was simply just a large 30,000-foot view. We didn’t really get into too much specifics but we did give a good fundamental background on how this technology works, both on the hardware level and on the data analysis level. And so from here, what we’re going to be doing in the next parts is, in Part 2 we’re going to be talking about creating a sample plan and analytical testing best practices, two things that really define the quality of a model and are often overlooked and are extremely important. And so that’s what we’re going to talk about next. In Part 3 we’ll talk more about the multivariate data stuff, spectra pre-processing types of modeling, and wavelength selection. And that will help you define the actual model that you’re going to be building and help get you the best model performance that you can possibly get.
In Part 4 we’ll talk about types of validation testing, and relevant statistics, because model validation is also something that is very often either not done robustly enough or not done at all. And so we’ll talk about how you can do validation testing in a way that is going to help inform you of the quality of your model. And then we’re going to talk about something that has always been a problem and a challenge in spectroscopy, and that is what we call calibration transfer. So, taking a model from one device and putting it on another device. We’ll talk more about that in Part 5. And then Part 6 is going to be about model maintenance and optimization. So, after you’ve deployed your model, how do you ensure that your model is going to keep performing as well as you want it to, and what are some strategies and some techniques you can use to help make sure that the model initially works right off the bat for you and your team. That one is going to be a little bit more focused on the specific F-751 and F-750 technology, and some strategies you can use with our devices to help ensure that the device is performing as best as it can for you.
All of these will have the app builder software and the F-751 and F-750 in mind, but they also apply across the board to all types of spectroscopy in the commercial agriculture sector or just in general. We really hope that you guys get a lot of good information out of these, and we’re really excited to be talking about this topic because it’s something that we take a lot of pride in and we take very seriously here. We’re very excited to be presenting this webinar series for you guys.
That concludes this first part of the webinar series, talking about the overview of NIR spectroscopy. If you have any desire to maybe get some pricing information or anything like that on 750 or 751, you can follow the link that Suzy is going to post in the chat for you guys. Since you’re not going to be able to click it on this screen here, it’ll be in the chat for you. If you want to just keep up updated with what we’re doing and new product development and stuff like that, please follow us on Facebook, follow us on Twitter, and you can always reach us by phone. We do have brand new websites up that we launched last year, so please check those out. That’s where you’ll always find more information. If you want to join our newsletter mailing list, then that’s a great way to find out more about what’s happening in the industry as well as, just in general, things that we’re doing here and the technology that we’re working on here in our facility at our headquarters.
Live Q&A
Other than that, that was everything for today. And I will jump into our Q&A. Looks like we have five questions. The first question from Kevin Forte: “Is tissue water content variability more likely to show up in NIR spectroscopy compared with 300-1200 nm spectroscopy?” If you’re asking about whether or not water content is more easily measured if you’re looking at 780-2500 versus 300-1200, honestly, water content is the easiest thing to measure. It’s very easily identifiable in both. Both of those wavelength ranges are going to have enough information in the spectra to easily model tissue water content. With using 780-2500 there is the risk of having maybe too much information, which can sometimes overwhelm the models. And so, if you narrow it down to only focusing on certain wavelengths, then it can sometimes make things better. But, not always. Honestly, both ways are equally as likely to be successful in modeling water content.
The next question is from an anonymous attendee: “Can NIR spectroscopy be used with an F-750 produce meter that is running on version 1.2.0 build” Okay, to this person I will say, all of the 750 and 751s are using NIR spectroscopy as the base technology of the devices. And so, everything’s already using that technology. The firmware version that you’re referring to is just more of a computer logistics thing — as we update firmware, as we update functionality and ability to use things like App Builder as the software, whereas previously we had a version of a software called ModelBuilder that was less functional than App Builder. So if you want to update your instrument, please reach out to our support team. And if you go to our website, you can go to the support page and submit a request to start a support ticket and we can get you upgraded so you can use the newest App Builder software if you want. It’s more smooth and more functional for you, and more intuitive.
The next question from Serge is: “Why do you limit yourself to the fruit industry only? What about grasses, corn, rice, etc., trees, etc.?” Well, really, when we’re looking at new product development, one of the biggest things is looking at customer needs, what technology is already out there, and what the market is like. We do have a device that is on our CID bioscience side of our business that is called the CI-710s SpectraVue, and that is actually a leaf spectrometer. So it’s using the exact same NIR technology but it’s meant to be used on leaves and it can be used on things like grasses or corn leaves. And that’s more to assess plant health rather than at the actual plant level and not really on the product level, like not on the corn cob or the end product. With the fruit industry, there was a gap to fill. Because in things like corn, wheat, rice, soy — large industries that have already existed — we have a lot of technology out there already, NIR technology, that has been developed and honed over years and years and years to help assess the quality of those products, and mostly after they’ve been harvested. And so, that’s why we haven’t necessarily dedicated ourselves to those industries. But like I said, if you’re interested in more of the plant health, then we do have that leaf spectrometer that can be used.
The next question from Christopher: “Adding to query by search, can it be used for analyzing milk, fruit juices, and the like?” We don’t currently have a liquid format. That is something that we’ve been looking at developing in our pipeline. There are other analyzers out there that are meant for looking at liquids, specifically milk and fruit juices. What I would do if I were you is to maybe do some research in looking up liquid spectrometers or liquid spectroscopy analyzers or something like that in your search. There are manufacturers out there that are producing spectrometers and analyzers for milk and fruit juices and stuff like that. But right now, the 750 and 751, I zero percent recommend trying to put liquid on those because it will likely ruin the instrument.
The next question from Christopher is: “One unit for multiple products?” And the answer is yes. The 750 that I mentioned, the F-750, is an open-ended research unit. And that unit comes with calibrations for avocado dry matter, mango dry matter, and brix; red, gold, and Hayward kiwi fruit for brix, hue, and dry matter; as well as some other proof of concept models that we’ve developed. The 750, you can put apps for multiple different commodities, and each of those apps for each of those commodities can have models for multiple different analytes. So, yes, that is the device that you would be most looking for if you wanted to do multiple products.
Another great question here is from an anonymous attendee: “As you showed in the early slides, a model needs to be related to other parameters such as brix or dry matter. What are other common parameters used?” That’s a great question. It really is more of a question of what are the industry standards for your commodity. A lot of people will look at things like titratable acidity in grapes. Or, color is a very common one, both internal and external color. People will oftentimes look at things like firmness. And there are also sometimes people that are interested in more nuanced aspects of their product, things more like protein content or fat content, stuff like that. But usually, it’s between things that affect end consumer acceptance — water content, sweetness, acidity, color, and firmness. And oftentimes, also, there are things not necessarily trying to quantify an analyte, but looking at defects. So maybe there’s a common defect or disease that is present in a lot of the fruit that you harvest, and so it can also be used in that regard to identify and sort out those kinds of parameters.
The next question from Jessica is: “Do differences in ambient light, and temperature influence readings in thin samples like leafy greens?” This is actually a great question. Things that influence spectra are temperature and pH. If the temperature of the sample is really high or really low and the model that you built was at room temperature, then you’re going to see differences in that spectra from the room temperature than you saw at the high temperature, versus low temperature. When you’re considering how you’re using these devices, you have to keep that in mind when you’re building your models. Same with pH. If you know that pH levels are going to vary in whatever you’re measuring — this is going to really tie into the next part when we’re talking about sampling plans — if you know that pH is going to vary, then you’re going to want to make sure you’re building that variability into your model. As far as ambient light, though, is concerned, as I mentioned, we have a reference shutter in our devices that is used to account for whatever lighting conditions you’re measuring. It’s going to reference that light against the spectra. So it’s actually correcting for whatever light conditions you’re in. And so, that should not influence the readings for your samples — the lighting. But temperature and pH both will.
The next question from Andreas is: “Has this equipment been used for soil analysis?” NIR spectroscopy has been used for soil analysis. I personally don’t know of anyone that’s used the 750, necessarily, for soil analysis. But as I mentioned, with the liquid spectrometer that is in our product development pipeline, you could use soil in replacement of the liquid, fill up whatever hole holster is there for the liquid for the device and put soil on it instead, and then analyze the soil that way. But no, as far as I’m concerned, no one that I know has used it really for soil analysis. But if you’re interested in it, I’m more than happy to have a one-on-one chat with you, if you want to email me directly or set up a consultation to talk about it further.
The next question: “The F-751 series have been made referencing the popular varieties of the fruit type, does this become a limiting factor with the F-750?” I think what this question is asking is, is there anything limiting what you can measure with a 750? And the answer is no. The only thing that limits what you can use the 750 with is the ability of the NIR light to penetrate into the tissue that you are interested in analyzing. And I worded that in that way because think of something like a pineapple or a grapefruit or a citrus with a really thick rind. If the rind is too thick — or a watermelon is a great example — NIR light is great at penetrating but it can’t penetrate all the way through an entire watermelon rind and into the flesh of the watermelon. If the flesh of the watermelon is what you’re interested in measuring, unless the rind has a specific constant correlation with what’s happening in the flesh, you’re not going to get any good modeling out of using the 750 or the 751 on an intact watermelon, or a pineapple. Because the outside is too irregular and too thick. So, the limiting factor isn’t necessarily the equipment but more so the sample that you’re going to be measuring. The 751s are limited to the fruit that we assign them to.
The next question: “A few mango varieties have spongy tissue issues, does the spectra look beyond the stone?” As I mentioned, the light penetrates into the fruit, depending on the thickness of the rind, and it can penetrate up to 1cm to 2cm, at most, 2cm, but typically around 1cm. So we are avoiding measuring the stone and avoiding measuring — if you’re looking at avocado, measuring the pit of the avocado, and we’re only looking at the flesh. You can look as deep as the light can penetrate but then you can also — Here’s what’s great about multivariate data analysis. If spongy tissue has an effect that is some kind of relationship between what’s happening on the flesh that you’re measuring or the part that you’re measuring with the light, then the multivariate data analysis can pick up on that and from that relationship, it can still form like a secondary relationship between what you’re measuring and the spongy tissue level, if there’s a constant effect between the spongy tissue level and what you’re measuring. Hopefully, that answers your question. There are a lot of ways in which this technology can model stuff that isn’t necessarily a direct measurement of the tissue that is being analyzed. I do know that there has been research with spongy tissue and that it is something that can be modeled or classified, at least.
“Does stone act as a barrier to detecting bad tissues in the flesh?” If the stone is acting as a barrier, then yes. As I mentioned, you’re not going to be penetrating that far enough to even get to the stone, let alone penetrate through it to the other side, if that’s what you are meaning. What’s happening is, your light is going into the mango, only a certain distance into the flesh, and that’s the limit of how far the NIR is penetrating. And then, the information that you’re directly measuring, if there’s something happening between the bad tissue and the good tissue, then you can still find ways to correlate those and model that based on the direct measurement of the good tissue, is what I’m trying to say.
The next question is: “Following on the question about parameters, can shelf life be predicted?” Actually, yes. There have been studies where shelf life is predicted. I’ve seen this in, I believe, spinach or some other leafy greens before, where they did a shelf life model. They didn’t measure any specific parameters, they just took a series of spectra throughout the shelf life and the number of days that it had been on the shelf was their analytical reference values. But they were able to successfully model the shelf life with the devices, yes. Strawberries, pre, and post-harvest, absolutely. Strawberries or berries of all kinds are going to be easily measurable. Mostly because they are: (a) smaller, and (b) usually tend to be a little bit thinner skinned, and so, easy for the light to transmit and pass through that and penetrate and get more information about what’s going on. So, strawberries absolutely can be modeled.
The next question is: “Can the F-751 for avocado measure other parameters?” The avocado meter only measures dry matter, which is directly correlated to oil content. Ever since the relationship between dry matter and oil content has been researched and sussed out as being a very direct relationship, direct correlation, people have switched over to measuring dry matter because it’s easier to model water than it is to model things like oil, which is the actual thing that people are concerned about and care about. But if you did want a model other things than avocados, it is possible. But you’d want to use the F-750 if you wanted to measure other parameters with the avocado besides dry matter.
The next question is: “How accurately can we predict shelf life? Do you recommend taking multiple readings over a timespan to document any changes?” Absolutely. Definitely, you want to take multiple readings. I highly recommend that you attend the next section of this, or the next part of the series of this webinar, where we talk about sampling plans and analytical testing. I think that will help provide a lot of insight into how robust you need to be when creating your sampling plan for doing modeling. But, yes. As far as accuracy, that’s going to be completely up to how robust the model is. It’s a factor of how well you can collect data as well as how good the chemometric multivariate data analysis is.
The next question: “Reflection and absorption for tomato NIR can you get both spectra out of the device?” If you don’t currently have a device and are trying to ask how to get those two, the reflectance and the absorbance spectra out of the device, let me know. You can email us directly — our support team directly — and we can help you get those spectra for that. But yes, you can acquire both of those spectra, and you definitely can use it in tomato. A lot of people have done tomato in the past with this device.
The next question, this is a great question: “Since calcium content is related to apple storability, can you discriminate samples using NIR spectroscopy due to changes in cell walls or to model cell wall dynamics during apple development and storage?” Changes in cell walls and also cell wall dynamics do influence NIR spectra. Physical changes like that are just as much of a factor as the chemical changes that we see in the bonds of the actual chemical constituents within the flesh. And so, yes, you could, in theory, develop models that track those changes in cell wall dynamics. The hard part, I think, would be how exactly you come up with a scale — and the next part of this series will be great for you as well — but trying to figure out what’s the scale you’re using. If it’s a classification model, you still need some reference thing to compare it to. You can make up your own scale to say, “This is looking at changes in cell walls early to late development stages,” and then you have a storage classification. And then within those, you have like a spectrum that you’re using of 0 to 10 to identify the different changes in the cell wall. There still needs to be some consideration in that regard. But yes, you could theoretically do that.
The next question is: “Following up on the earlier question, is there a reason that we use 350-1100 nm rather than 850-2500 nm? Are there issues with the measurements and analyses done in these longer wavelengths?” No. Kevin, the reason we’re using the shorter wave of NIR — the 350 are invisible to NIR — is that in a lot of cases, the visible spectrum still gives us useful information when it comes to things like quality, things like color, and stuff like that. But also, spectrometers in the 850-2500 nm range, first of all, are typically not in a format where we can put them in a portable device. And also, are not usually as high of resolution as the shorter wavelength ones we get. If we want really high-resolution spectrometers in the 800-2500 nm range, then those are larger spectrometers, but they’re also very expensive. If we want this technology to be accessible to people like farmers and people that are doing innovations in AgTech — that’s why they don’t have the budgets for these more expensive spectrometers. We can still get the modeling capacity for a lot of the key analytes that most people are concerned with, with the lower range spectrometer that is much more affordable and more easily put into a portable format. The spectrometers that go up to 2500 nm are almost always installed in the benchtop instruments, the ones that I mentioned earlier in the presentation. Those benchtop instruments are typically the ones that have the higher range, the whole NIR spectrum range.
The next question is: “Can they be paired with barcode readers?” And that is a great question, Serge. I’m pretty sure the answer is yes. I think we developed a — actually, Serge, if you want, please reach out directly to me. I feel like we recently did create a custom app for a customer that had the ability to be used with barcode scanners to fill in all that metadata and organizational data as they scan. So, yes, it absolutely can be, and it has been done before. But if you want that capability, just let us know and we can help you out with that.
The next question is: “Can you send detailed information to all participants about the main competitors and our advantages against their similar models?” If you’re looking for comparisons between the Felix Instruments portable quality sensors versus someone like Foresters or SCiO or those other portable NIR companies, if you’re interested in that information, reach out to us directly and we can help provide comparison information.
The next question is: “We are dealing in potatoes, can potatoes be modeled just as easily as any other commodity like apples or anything like that.” So, yes, any kind of potato, sweet potato, russet — whatever you’re doing — gold, whatever it is, you can definitely model with the F-750.
The next question is: “Is it possible for you/Felix to create a matrix with fruit, veg, and possible parameters?” Okay, so you’re looking for what commodities are able to be modeled and what parameters are able to be modeled with those different commodities. We actually do have an infographic like that. What it shows are things that we have either tested in-house or things that are in the literature that have been tested with this technology, and the parameters we have measured with that. And so, we have an infographic that we can send. Please send us your email if you want that since you’re an anonymous attendee, then we can get that to you if you want it. Just send us an email directly and we’ll get it to you.
Next question: “When you take measurements in the fruit and the orchard you have to avoid light. Light might interfere with the reading.” With our device, the reference shutter eliminates that. And we’ve done studies to show that the light conditions do not influence in-field, what is happening with the scanning and what the results of the scans are. The results of the most recent study that we did were in kiwi fruit and kiwi fruit orchards, and if you are interested in seeing that data I can most certainly show it to you. Feel free to reach out directly and I can send you that data.
Next question: “What about apples and other fruits like pears?” Easily modeled, both of them, and have been by plenty of researchers. We have a couple of different researchers right now that are actively modeling different traits in apples and pears. If you want to use the F-750 for that, then you absolutely can.
The next question: “What is the time required for measuring solids or dry matter in potatoes?” The amount of time you put into the model-building process is going to be determined by how robust and how accurate you need the model to be. And also, if you’re more concerned about how long it takes to do a scan, a single scan time is usually around 10 to 15 seconds at most. That’s how long it would take, after you built the model, for you to get a single data point for a solid set of data. I would highly recommend you attend the next part of this series so that you can get more insight into how robust the model-building process needs to be.
All right, three questions left. “Is there any scope to measure sugar levels in potatoes, especially sucrose and glucose content instantly in fields?” The problem with differentiating sucrose and glucose with NIR spectroscopy, as I mentioned, the data is convoluted. There are combination bands, there are overtone bands, that’s why we have to use multivariate analysis to even pull out any of this information. NIR isn’t that great of a technology for identifying specific chemicals. The mid-infrared region, where I told you those fundamental vibrations are, that’s something like Raman Spectroscopy or FTIR spectroscopy. Those are great technologies right now to find specific chemicals. They have more distinct bands for different chemicals. But NIR is a little more — the bands overlap and they’re more broad. It’s easier to just do sugar content overall. It’s going to be more difficult to do a breakdown of sucrose and glucose. If you want to go that route, it’s going to be more work and harder, and probably less successful to go with measuring individual sugar levels, as opposed to just overall sugar content.
The next question is: “What is the best model to use?” That is a great question. I am partial to kiwifruit because I like it, but it really all depends on what the best model for you is going to be. What is the commodity that you’re using and what do you want to measure — what parameters do you want to measure? If you’re asking about how to choose the best model, that is something that’s going to come up in the upcoming sections, as I mentioned, upcoming parts of this webinar series. So, stick around for that.
The next question is: “Is it possible to measure chlorophyll in fruit tree leaves?” Absolutely. You can do that with 750 or 751. But we do, as I mentioned, have the 710s SpectraVue which is a great device for measuring the actual leaves.
I see there’s a question here that I missed: “Can I use the 751 for apples and plums?” Absolutely. You can use it for both. It has been done for both stone fruits and for apples and pears, as I mentioned.
Last question from Brandon: “Following up on a previous question, is the 710s SpectraVue sensitive to ambient light? So I guess maybe the light question wasn’t about 751 and more about the 710? I might have misread that. But since it is a clip-like construct, no, they’re sensitive to ambient light, because it’s a closed environment, essentially. You won’t be sensitive to ambient light with 710s.
And that is the last question. I have to log off here, we’re definitely over time. But I really appreciate everyone’s questions and I appreciate all the questions that everyone asked and the feedback. If you need to reach out to us directly, please feel free to do so. If you have further questions, if I didn’t get around to answering your question or I didn’t answer it in a way that you wanted me to, just feel free to send us an email and I will elaborate on it further and we can make sure we can come to a good conclusion. Everyone will receive a recording of this, if I didn’t mention that already, everyone should receive a recording of this. If you’re registered and you didn’t attend, you still get a recording. Everyone that was registered gets a recording of this at the end of the webinar, once it’s been processed. Thank you, everyone, so much.
Related Products
Most Popular Articles
- Spectrophotometry in 2023
- NIR Applications in Agriculture – Everything…
- The Importance of Food Quality Testing
- The 5 Most Important Parameters in Produce Quality Control
- Melon Fruit: Quality, Production & Physiology
- Fruit Respiration Impact on Fruit Quality
- Guide to Fresh Fruit Quality Control
- Liquid Spectrophotometry & Food Industry Applications
- Ethylene (C2H4) – Ripening, Crops & Agriculture
- Understanding Chemometrics for NIR Spectroscopy