Spectrophotometry in 2023
Dr. Vijayalaxmi Kinhal
January 19, 2021 at 6:58 am | Updated February 28, 2023 at 6:49 pm | 9 min read
Spectrophotometers have come a long way from the first model invented in 1940. Miniaturized and combined with other modern technology, these devices now have a wide range of research and practical applications in food, medical, industrial, and environmental fields. This article focuses on the reasons for the popularity of spectrophotometry techniques.
Principle of Spectrophotometry
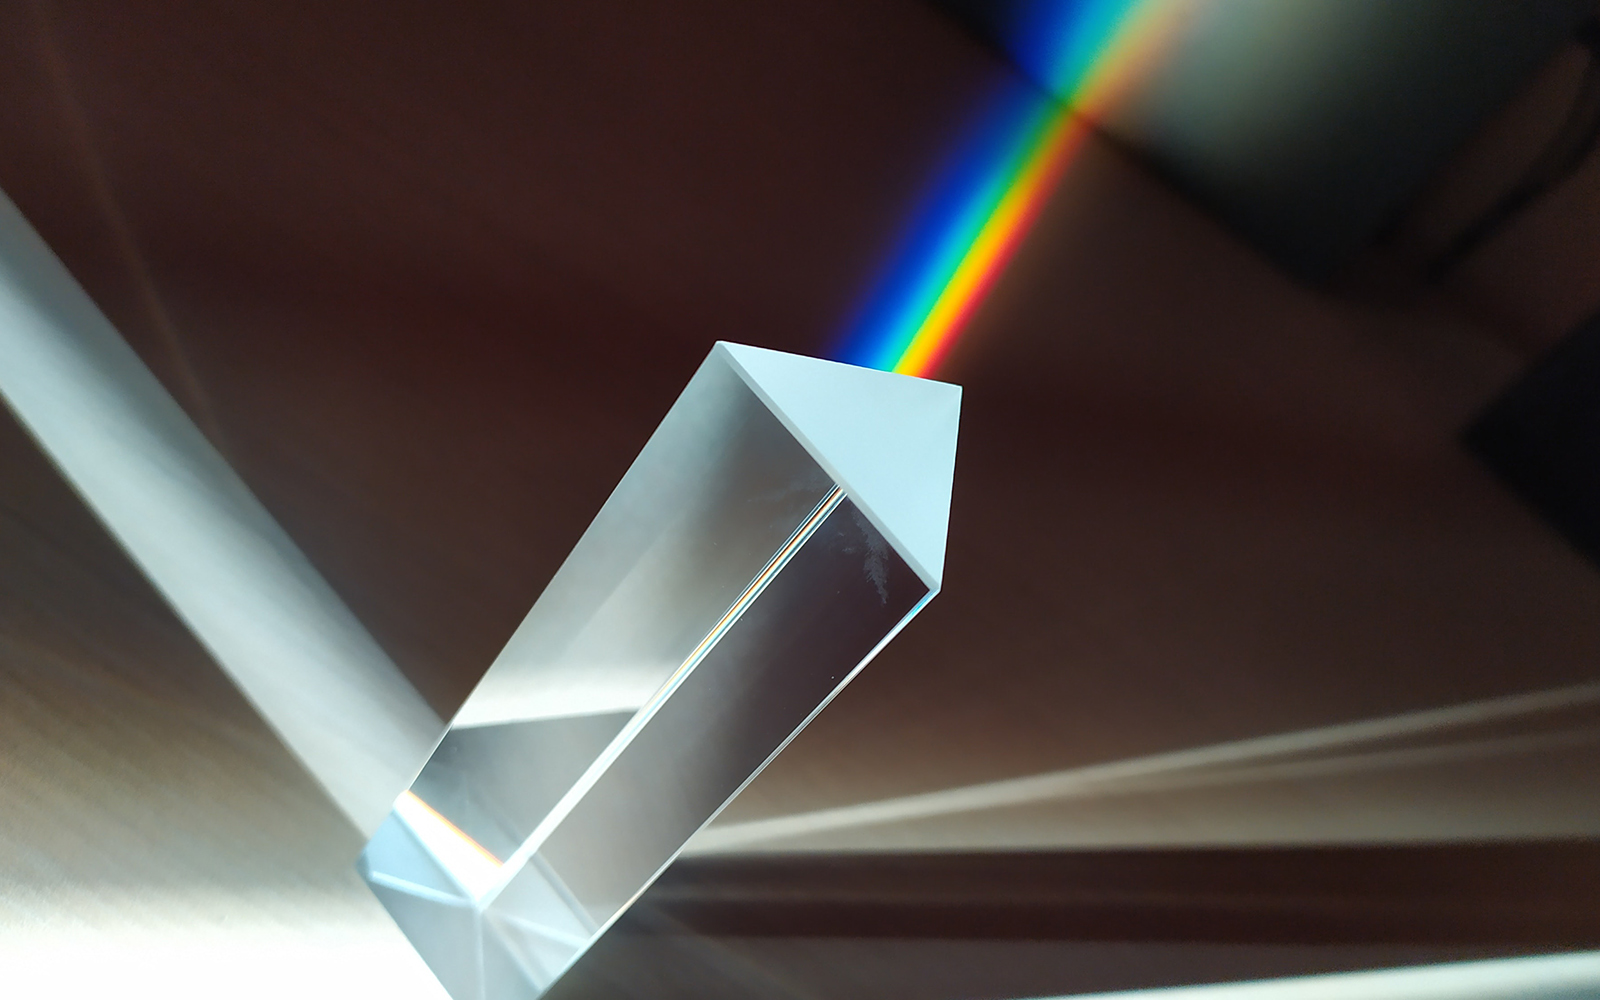
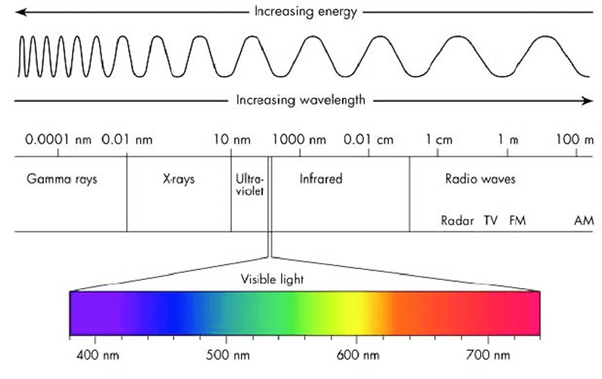
Light consists of electromagnetic radiation with a wide range of frequencies, wavelengths, and energies that all travel at the same speed. This includes the visible spectrum and radiation of longer and shorter wavelengths on either side of the band; see Figure 1.
Subscribe to receive our monthly round-up of articles.
Figure 1: The wavelengths and energies of light’s electromagnetic spectrum. (Image credits: Lumenistics, 2012)
Light is split when it strikes an object, as some parts of it are absorbed, and the rest is reflected or transmitted. The kind of interaction depends on the wavelengths of the light and the object’s chemical composition. The resultant distribution in terms of frequency and wavelengths is called a spectrum. The spectrum of light that objects emit gives us information about their makeup. For example, Figure 2 shows the different spectra produced by common elements.
You can see this phenomenon occurring in everyday life. Leaves look green because chlorophyll absorbs blue and red light, emitting the remaining light of green wavelengths.
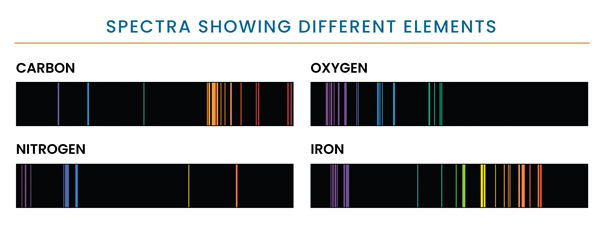
Figure 2: The different spectra produced by the four elements vary, NASA. (Image credit: https://hubblesite.org/contents/articles/spectroscopy-reading-the-rainbow)
What is Spectrophotometry?
Spectrophotometry is the quantitative measurement of the intensity of light of various wavelengths in the spectrum emitted by matter.
The quantitative measurement of the interaction of matter with specific wavelengths has important applications in many fields of science, including physics, chemistry, astronomy, and biochemistry.
Spectroscopy vs. Spectrophotometry
Spectrophotometry may seem similar to spectroscopy.
However, there is a vital difference between spectroscopy vs. spectrophotometry. Spectroscopy is used to analyze matter based on the wavelengths produced in the spectrum, while spectrophotometry analyzes matter based on the intensity of light in each wavelength involved in light’s interaction with matter (absorbance, reflectance, transmittance).
Thus, spectrophotometry is based on spectroscopy and can be called an application of the latter.
Spectrophotometry applications are useful to measure the absorbance, reflectance, and transmission of light by gases, liquids, and solids.
What does a Spectrophotometer Measure?
A spectrophotometer measures the number of photons emitted to estimate the intensity of light spectra absorbed and transmitted by a sample. This provides information on the amount of a compound in the sample. For example, clear water will allow more light to pass through than a solution colored with pigments, which will absorb more of the light in many wavelengths.
The light band that each compound will absorb will differ. For example, Figure 3 shows that chlorophyll a and b absorb many wavelengths, but chlorophyll a absorbs more violet and orange light, while chlorophyll b absorbs more blue and yellow wavelengths.
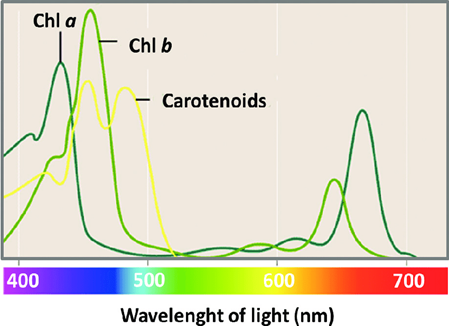
Figure 3: The specific wavelengths that are absorbed most by chlorophyll a and b and carotenoids differ, Guidi, et al. 2017. (Image credits: Chlorophyll; Intech, DOI: 10.5772/65594)
How Spectrophotometers Work
While the size and design of a spectrophotometer can differ, they each consist of a few basic parts (see Figure 4):
- A light source that gives monochromatic/white light.
- Collimator to converge the light into a parallel beam.
- Monochromator to split monochromatic light into the component wavelengths. These can be prisms that split white light into the component visual colors. The monochromator can also grate to get UV, visual, and IR radiation bands.
- Wavelength selector, which is a slit that is used to select the desired wavelength/light band.
- Cuvettes, or vessels, are usually made of glass or quartz to hold sample solution.
- Photometer is a photosensitive detector to measure the amount/intensity of light absorbed and transmitted through the sample.
- Result display section, which can be a meter or a digital screen.
There are two spectrophotometer types based on the light band chosen for analysis:
- The UV-visible spectrophotometer uses visible (400 – 700 nm) and ultra-violet (185 – 400 nm) bands of light.
- The IR spectrophotometer uses infrared light as the source.
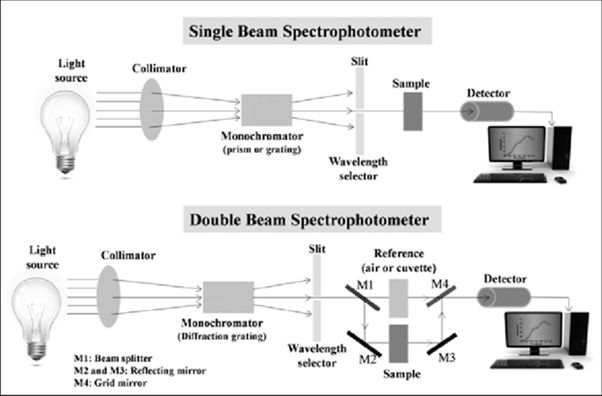
Figure 4. Parts of a single beam and double beam spectrophotometer, Jena et al. 2015. (Image credits: https://www.researchgate.net/project/Microstructure-and-Optical-Properties-of-Thin-films-and-Multilayer-Optical-Coatings)
Spectrophotometer Price Points
There are two kinds of spectrophotometers: single-beam and double-beam. See Figure 4 for schematic diagrams.
Double-beam spectrophotometers compare the light intensity of the spectrum from a sample to a reference beam. Applications requiring stability, speed, and automation rely on double-beam spectrophotometers, which are expensive. These typically have similar or better precision than single-beam spectrophotometers.
Single-beam spectrophotometers are cost-effective compared to double-beam variants and have the potential to perform better, as they do not need to expend energy splitting the beam. However, these devices are less stable than their double-beam counterparts. Moreover, they require more work, as users must provide a reference to standardize the device before using it.
Laws of Spectrophotometry
Besides the wavelength of light, the absorbance of a spectrophotometer is influenced by the amount of a compound in a solution and the size of the cuvette. Two laws define these aspects: Beer’s Law and Lambert’s Law. These laws are considered the principles of spectrophotometry.
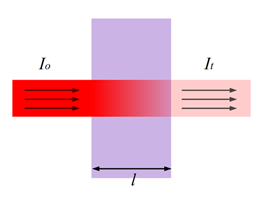
Figure 5: “Transmittance (illustrated by Heesung Shim).” (Image credits: https://chem.libretexts.org/Bookshelves/Physical_and_Theoretical_Chemistry_Textbook_Maps/Supplemental_Modules_(Physical_and_Theoretical_Chemistry)/Kinetics/02%3A_Reaction_Rates/2.01%3A_Experimental_Determination_of_Kinetics/2.1.05%3A_Spectrophotometry)
Lambert’s Law states a direct but non-linear relationship exists between the length of the light path through the cuvette/sample (l) and the intensity of light transmitted, as shown in Figure 5. It is the intensity of light before it enters the sample, and It is the intensity of light after it has passed through the sample.
So Transmittance (T) = It / Io
Beer’s law states that light absorbance depends on solute concentration (c).
The combination of the two laws, called the Beer-Lambert Law, states that absorbance depends on solute concentration (c), it’s molar absorptivity or absorption coefficient (ϵ), and the length of light path (l).
So, Absorbance (A) = ϵlc
Absorbance and transmittance have no spectrophotometric units of measurement.
However, the light path length (l) is measured in cm, and ϵ is measured in L·mol-1·cm-1.
Usually, the spectrophotometer cuvette width (or light path length) is 1 cm, and the molar absorptivity of a solute is known, so based on the absorbance reading, the device can calculate the concentration or amount of solute (c) in the sample.
Spectrophotometer Uses and Applications
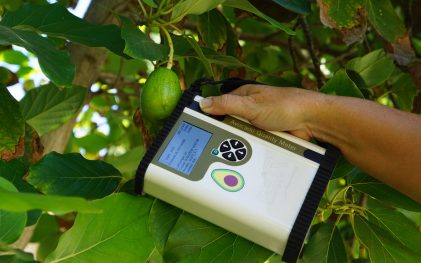
Spectrophotometry’s availability in small, portable, and affordable devices is expanding the use of this precise technique in scientific and practical applications.
Liquid spectrophotometry was the first application of the technique. However, it is now also common for spectrophotometers to analyze opaque solids, including glass, and various films, such as those used in semiconductor manufacturing. Similarly, gas spectrophotometers are used to analyze air pollutants.
Spectrophotometry analysis has several functions:
- Quantifying concentrations of compounds
- Determining the structure of a compound
- Finding functional groups in chemicals
- Determining the molecular weight of compounds
- Determining the composition of materials
These spectrophotometry analyses of organic and inorganic compounds have applications in the following:
- Determining the composition of materials as each element/compound can be identified based on its spectrum
- Detecting impurities in organic compounds, with the help of unique spectra of each compound
- Determining the rate of reaction based on the formation of compounds
- Determination of inorganic compounds by checking their composition
- Determination of proteins as functional groups
- Determining the growth of microorganisms by molecular biology applications
Where Are Spectrophotometers Used
Several branches of science and industry make use of the applications of spectrophotometry analysis, with the notable ones being
- food science,
- biochemistry research,
- medical diagnostics,
- forensic science,
- water and air analysis,
- and industrial applications.
Food Science
One of the most important and rapidly increasing branches of spectrophotometry applications is in the food supply chain. The technique is ideal for determining the organic compounds in ingredients and food mixtures.
NIR spectrophotometers are used for food analysis, as this light band targets the organic bonds formed between compound elements. These tools are simple to use and simultaneously give rapid measurements of several constituents. Moreover, as water absorbs less, NIR spectrophotometry can analyze food and ingredients with high water content, such as wine.
All the main stakeholders of the food chain – farmers, processors, distributors, retailers, and restaurants – can benefit from spectrophotometry analysis.
Uses of spectrophotometry can be found in practically all categories of food at every stage of the supply chain, as discussed below:
- Farmers analyze the ripeness of fresh produce, the moisture content in grains, the quality of milk, and meat tenderness. The technique is useful for quality control and specifying raw materials to enable correct labeling and improve pricing.
- Processors check raw materials’ chemical content and origins, like olives for oil and cocoa for chocolates. Spectrophotometry is useful for verifying and selecting raw materials (e.g., in cheese making) or to control manufacturing and help in labeling.
- Distributors analyze the quality of flour or coffee beans and check the chemical composition and origin of products like honey. Monitoring the quality of products during storage and distribution and having precise classification can increase profits.
- Retailers and Restaurants analyze water, bread, dairy products, and the age of fruits to ensure the quality of food they provide consumers, extend storing time, and get better prices.
- Governments and other certifying agents can analyze all food for microbial and toxicological contamination on site and improve quality control.
Biochemistry Research
UV-vis spectrophotometers are used in the qualitative and quantitative estimation of DNA, RNA, and proteins. These applications are useful in identifying species and monitoring enzymatic reactions to determine the products formed and estimate rates of reactions.
Medical diagnostics
There are several applications of spectrophotometers in the medical field. They can be used to diagnose diseases and analyze blood. Trials have established that hand-held spectrophotometers can be used for non-destructive diagnostics, such as
- finding disturbance in blood circulation,
- predicting the outcome of gastrointestinal ulcer treatments,
- and monitoring drug dynamics in human and animal tissues.
Spectrophotometric measurements are also used extensively in the pharmaceutical industry.
Forensic Science
Both UV-vis and IR spectrophotometers are used to trace evidence in forensics. Micro-spectrophotometry analyzes impurities in materials such as textiles, hair, oil, etc., that are too minute to be examined even by microscopes. Similarly, spectrophotometric measurements can also identify cosmetics, inks, drugs, pesticides, fungi, etc., collected from evidence or as evidence.
Another application of spectrophotometric measurements is to estimate the age of bruises by studying blood degradation.
Water and Air Analysis
Currently, there are several major sources of water pollutants: chemicals and animal wastes from farms, oil, and plastics, as well as industrial and untreated sewage discharges. These affect the quality of water in rivers and groundwater. Air pollutants come from burning agriculture and fossil fuels such as oil, gas, and coal.
Specific pollutants or aggregates can be easily analyzed qualitatively and quantitatively by UV-vis spectrophotometers to control and monitor water and air quality.
Industrial Uses of Spectrophotometers
There are several applications of spectrophotometric measurements in industries.
Spectrophotometry is used as an analytical technique to find failures in the aerospace, chemical, oil, and gas industry by analyzing the metal alloys, such as iron and aluminum. For example, aluminum alloys are used in structural components in aerospace so that spectrophotometry can detect faults and weaknesses in structures.
Spectrophotometry is also used in the quality control of paint systems and cement.
UV-vis spectrophotometers are suitable for colorimetry applications in industries that use pigments, such as printing, textiles, or ink production.
Increase in Spectrophotometric Analyzers
Several sensors, devices, probes, or instruments use spectrophotometry to analyze solids and liquids’ biochemical and physical characteristics. There is a wide and growing range of spectrophotometers on the market today. For example, the CI-710s SpectraVue Leaf Spectrometer is a NIR spectrophotometer used to study many physiological processes and detect plant stress. Its novel application is the non-destructive quantification of chemical concentrations and plant color analysis.
Thus, the application of spectrophotometry continues to develop rapidly into many new spheres.
—
Vijayalaxmi Kinhal
Science Writer, CID Bio-Science
Ph.D. Ecology and Environmental Science, B.Sc Agriculture
Feature image courtesy of Neal Fowler.
Sources
Abushattal, A. (2019). What is different between spectroscopy and spectrophotometry? Retrieved from: https://www.researchgate.net/post/What-is-different-between-spectroscopy-and-spectrophotometry/5cf9b03da4714bb58c6c118e/citation/download.
Bagai, E. (n. d). How Is Spectrophotometry Used in Forensics? Retrieved from https://www.techwalla.com/articles/how-is-spectrophotometry-used-in-forensics
Bassiri, E. (n. d). Spectrophotometer. Retrieved from https://www.sas.upenn.edu/labmanuals/biol123/Table_of_Contents_files/8b-EnzymeKinetics-Spec.pdf
Deepak. (2013, Dec 18). Comparison between Single Beam and Double Beam Atomic Absorption Spectrometer Systems. Retrieved from https://lab-training.com/2013/12/28/comparison-between-single-beam-and-double-beam-atomic-absorption-spectrometer-systems/
Diaz, I. E. (2019). Re: What is different between spectroscopy and spectrophotometry? Retrieved from: https://www.researchgate.net/post/What-is-different-between-spectroscopy-and-spectrophotometry/5cc0047ea7cbaf52644c70c4/citation/download.
Graybeal, J. D., Hurst, G. S., et al. (2020, Nov 6). Spectroscopy. Encyclopædia Britannica. Retrieved from https://www.britannica.com/science/spectroscopy
Hughes, V. K., Ellis, P. S., Burt, T., & Langlois, N. E. (2004). The practical application of reflectance spectrophotometry for the demonstration of haemoglobin and its degradation in bruises. Journal of clinical pathology, 57(4), 355–359. https://doi.org/10.1136/jcp.2003.011445
Morawski, R.Z. (2008). On Food, Spectrophotometry, and Measurement Data Processing. Keynote Lecture. 12th IMEKO TC1 & TC7 Joint Symposium on Man Science & Measurement, Annecy, France. Retrieved from https://www.imeko.org/publications/tc7-2008/IMEKO-TC1-TC7-2008-IKL-002.pdf
NASA. (2019, May 30). Spectroscopy: Reading the Rainbow. Retrieved from https://hubblesite.org/contents/articles/spectroscopy-reading-the-rainbow
Omoniyi, O. (2019). Re: What is different between spectroscopy and spectrophotometry? Retrieved from: https://www.researchgate.net/post/What-is-different-between-spectroscopy-and-spectrophotometry/5cc3b293b93ecd036a0a7de0/citation/download.
Rojas, F.S., Ojeda, C.B, & Pavón, J. M. C. (2019). Spectrophotometry | Biochemical Applications, Editor(s): Paul Worsfold, Colin Poole, Alan Townshend, Manuel Miró,
Encyclopedia of Analytical Science (Third Edition), Academic Press, Pages 205-213,https://doi.org/10.1016/B978-0-12-409547-2.00501-1.
Science Direct. Spectrophotometry. Retrieved from https://www.sciencedirect.com/topics/chemical-engineering/spectrophotometry
Vo, K. (2020, Aug 15) .2.1.5: Spectrophotometry. Retrieved from https://chem.libretexts.org/Bookshelves/Physical_and_Theoretical_Chemistry_Textbook_Maps/Supplemental_Modules_(Physical_and_Theoretical_Chemistry)/Kinetics/02%3A_Reaction_Rates/2.01%3A_Experimental_Determination_of_Kinetics/2.1.05%3A_Spectrophotometry
Zhang, X., Fang, Y., & Zhao, Y. (2013). A Portable Spectrophotometer for Water Quality Analysis. Sensors & Transducers, 148 (1), 47-51. Retrieved from https://www.researchgate.net/publication/288203737_A_Portable_Spectrophotometer_for_Water_Quality_Analysis
Related Products
Most Popular Articles
- Spectrophotometry in 2023
- NIR Applications in Agriculture – Everything…
- The Importance of Food Quality Testing
- The 5 Most Important Parameters in Produce Quality Control
- Melon Fruit: Quality, Production & Physiology
- Fruit Respiration Impact on Fruit Quality
- Guide to Fresh Fruit Quality Control
- Liquid Spectrophotometry & Food Industry Applications
- Ethylene (C2H4) – Ripening, Crops & Agriculture
- Understanding Chemometrics for NIR Spectroscopy