Welcome to our exclusive webinar on efficient farm management with Fruitmaps. This session is perfect for farmers, agricultural consultants, and researchers looking to enhance their farm operations using advanced technology.
What You’ll Learn:
Expert Guidance: Insights from industry experts on optimizing farm operations with Fruitmaps.
Q&A: Watch the viewer’s questions get answered.
Exclusive Access: See Fruitmaps in action and understand how it can improve your farming practices.
Request a Quote | Schedule a Demo
For the full slide deck, head here.
About Fruitmaps:
Fruitmaps is a top-tier farm management software developed through extensive research and on-farm experience. It helps farmers boost efficiency, improve productivity, and make data-driven decisions for superior crop management.
Watch the webinar replay now and take the next step in revolutionizing your farming practices!
for more information on Fruitmaps: fruitmaps.com
Full video Transcript:
Welcome everyone thank you for joining us today uh we’re really excited today to be announcing the
launch of our newly updated fruit Maps website and so uh today what we’ll be
doing is going through a little bit about what fruit Maps is is what it can do what it’s capable of and then I’m
actually going to walk you through the website itself and show you the features uh and particularly how they pertain to
the F750 and F75 produce quality meters before we get started though I
want to do a little bit of light housekeeping so Susie Truitt our
distributor manager is basically hosting the webinar today and she well not
hosting she’s moderating and she is going to be on the chat and and making sure that any kind of technical
difficulties you’re experiencing are addressed she’ll also be posting relevant links there so if I mention at
any point uh a link then that’s going to be posted in the chat since you won’t be able to actually physically click it on
my presentation uh if you do have questions that pertain to the content of the
webinar then please make sure you put that in the Q&A function because that’s what I’ll be checking at the end of the
webinar in order to answer and address all your questions so please do not post questions that pertain to the webinar in
the chat leave that only for technical difficulties or for looking for links
that you can click on uh as I mentioned Susie is moderating but my name is gayen George uh and I am
the director of applied science at Felix instruments I’ve been with the company for about five years now and my
bachelor’s degree is in Biochemistry my master’s degree is in food science from Michigan State University my background
is mostly in quality and safety assessment in the food Agriculture and cannabis Industries
Agenda
so we’re going to start by kind of laying out the agenda for today
like I mentioned I’m going to give you some background on fruit Maps specifically what is a harvest
management information system then we’re going to go into the actual use case of this software specifically as I
mentioned with the F750 and the f7551 produce quality meters how those how
that data is integrated with fruit maps and how it can be useful for uh all sorts of Growers out there at the end of
this I’ll go through a live demo and I’ll actually walk through all the different features of the new fruit Maps
platform and then we’ll open it up to questions uh and you I’ll answer those in real time as I mentioned uh all
questions should be posted in that Q&A
function so starting off with Harvest management information systems so how are we utilizing data to inform
decisions with this new software so with fruit Maps what we’re doing is we have
essentially a a three component process right so we have a data acquisition
system then we have that data going into a harvest forecast engine and then after
that Harvest forecast engine that data is then output into a management information system so there’s kind of a
it’s a three-step process to utilizing this technology this new software so the
data acquisition system the actually actual acquiring of the data that’s going to go into the decisions that
you’re making um there’s a lot of different data inputs that this new system can handle and we’ve actually
partnered with sensor host and freelance robotics uh to allow for a total
integration of their Technologies into this uh platform so off the bat we have dry
matter data or any kind of internal quality attribute data so you know the F750 and F75 typically are measuring
things like dry matter bricks uh titratable acidity in some cases and other quality attributes so from our
devices itself that data can be input into this software platform and that
data is one of the components that can go into this Harvest forecast engine we’re going to focus on that today but
I’m about to mention the the other couple of data inputs that you can use
uh to help even further your robustness of your decision making so we also have
things like fruit size fruit count and flower count those can all be done
manually using the Orion app from freelance robotics or you can also uh
use uh their Machine Vision platform uh which is a uh you know non-manual way to
get all that data really rapidly um and then we also have the temperature data which uh is where we integrated the the
the sensor host sensors uh which all do temperature data in the field so all
five of those data inputs going into then the Harvest forecast engine which
is the kind of what’s running in the background the data analysis that’s running in the background of the uh
software platform and so with the Harvest forecast engine we can look at things like peak flower date uh the heat
units if you’re using a heat unit based system for determining your har uh dry matter targets which is what
we’re going to focus on today spatial distribution of your fruits within your trees uh and within your uh blocks um we
have size forecasting and then we have like weekly scheduling and understanding exactly where you need to have bins how
many bins you’re going to need in order to do that Harvest uh in the most successful way and all of that gets
output in the user interface of fruit maps in different ways we’ve got tables
we’ve got different map layers you can compare Maps we can compare Seasons uh
lots of different charts and graphs for you to look at to be able to inform yourselves whether or not uh it’s time
to harvest or whether or not you need to wait um we also have notification systems that you can use in order to
help make sure that you’re aware that you know Peak Harvest time is coming faster than you thought it was going to
or might be delayed um so that’s kind of the the whole system in itself uh of
fruit map since we’ve kind of expanded from initially just being about the dry matter stuff to now expanding to a more
holistic uh robust approach to managing your Harvest now this uh on the right this
other graphic is just showing that how this uh data flow actually works and so we we’re taking all these data inputs on
the left and we’re throwing them into that Harvest forecast engine so all this data on the left is stuff that the
grower would collect um using either manual meth methods or using the technology like from freelance robotics
or sensor host using the F750 and 751 to collect uh maturity Spectra which will
give you the predictions right on the device for dry matter or bricks um all that data gets uploaded into the Harvest
forecast engine and from there it goes into all these different data analytics
tools right so we’ve looking at heat unit charts heat maps on the actual map of where things are maturing the most
how many fruit you have in all your different trees and all your different blocks being able to do things like bin
placement estimating fruit load uh and estimating Harvest Time so it’s a really
kind of robust Harvest management system U that we’ve try to build
here and like I mentioned we want to focus specifically on the F750 and the
F7 51 and how those are going to be used with in conjunction with fruit Maps so
if you are a his hisorical user of fruit Maps um in our first iteration of fruit Maps then you kind of understand the
idea of being able to wirelessly upload data from your device directly to this
fruit mapping software well now it’s the same exact function where you’re
essentially going out into the field taking all that data with your F750 or your f7551 your dry matter data your
bricks data and that data being automatically imported into your uh uh
specific Farm your specific block since everything is GPS tagged then
everything’s going to have a very specific uh uh point on the map for that dry matter or that bricks or whatever
the internal quality trade is and so with that data if you collect that data
over time what we can do is we can actually observe the rate of change of
dry matter and we can forecast so we the the goal of this entire thing is to be able to forecast when we want to harvest
and so for mangoes for example on this graph on the right they have set a
Target threshold for dry matter of 17 dry matter 17% dry matter and so as you
can see they collected data from early December for a week or so and they were able to observe a dry matter increase
from 14 to 16 from that we they were able to the actual fruit map system is
able to forecast with that rate of change exact what date is going to be
the optimal Harvest Time and so you can do this on a block level which is the other nice thing because not all blocks
and your farm are going to be the exact same so every block is going to have its own trending chart like this where you
can see and forecast exactly when your optimal Harvest time is for avocados
that threshold can be set to something like more like 21 or 21 and a half%
whatever it is that is required of you to hit for that Target threshold of dry matter you can set it to that level and
then it’ll forecast for you as you collect data over time it’ll forecast when that optimal Harvest time is so
that’s how we want to be using the instrument that’s a you know the optimal way to be utilizing it to plan for your
harvests and make sure that you’re getting the most out of your
Orchards so the actual meet and potatoes of this presentation I need to go ahead and show you the actual software because
it’s live right now it’s available ailable to be viewed and I want to take you through everything from the landing
page all the way through all the settings so I’m going to go ahead and stop my share really quick and then I’m going to reshare my
screen and here you should see the landing page for fruit maps.com
so the URL hasn’t changed it’s the same URL as it was in the past and here is the new and improved landing
page so as you can see it is now Orion fruit Maps Orion is
the platform that is utilized by freelance robotics in order to do all their flower and fruit counting the M
both the Machine Vision and the manual stuff so we went with the name Orion fruit maps to reflect that the landing
page has all the information you could possibly need as far as what this platform does everything that I kind of
just reviewed for you should be on this landing page already here for you all
that information we’ve got an introductory video if you want to watch that you can also book a free
consultation to discuss whether or not this uh solution is right for you or how you can implement this with your
organization you can also click here for an over overview or you can simply uh
start to register by clicking this get started button this will take you to a landing page where you can input all of your information and we’ll get in touch
with you to get you your account set up and everything so I’m going to switch over
to a logged in version of this actually if I escape out of this then you should
be seeing a version of fruit Maps when you immediately log in this is what it
might look like for you I’m using a demo account that uh has data in it already
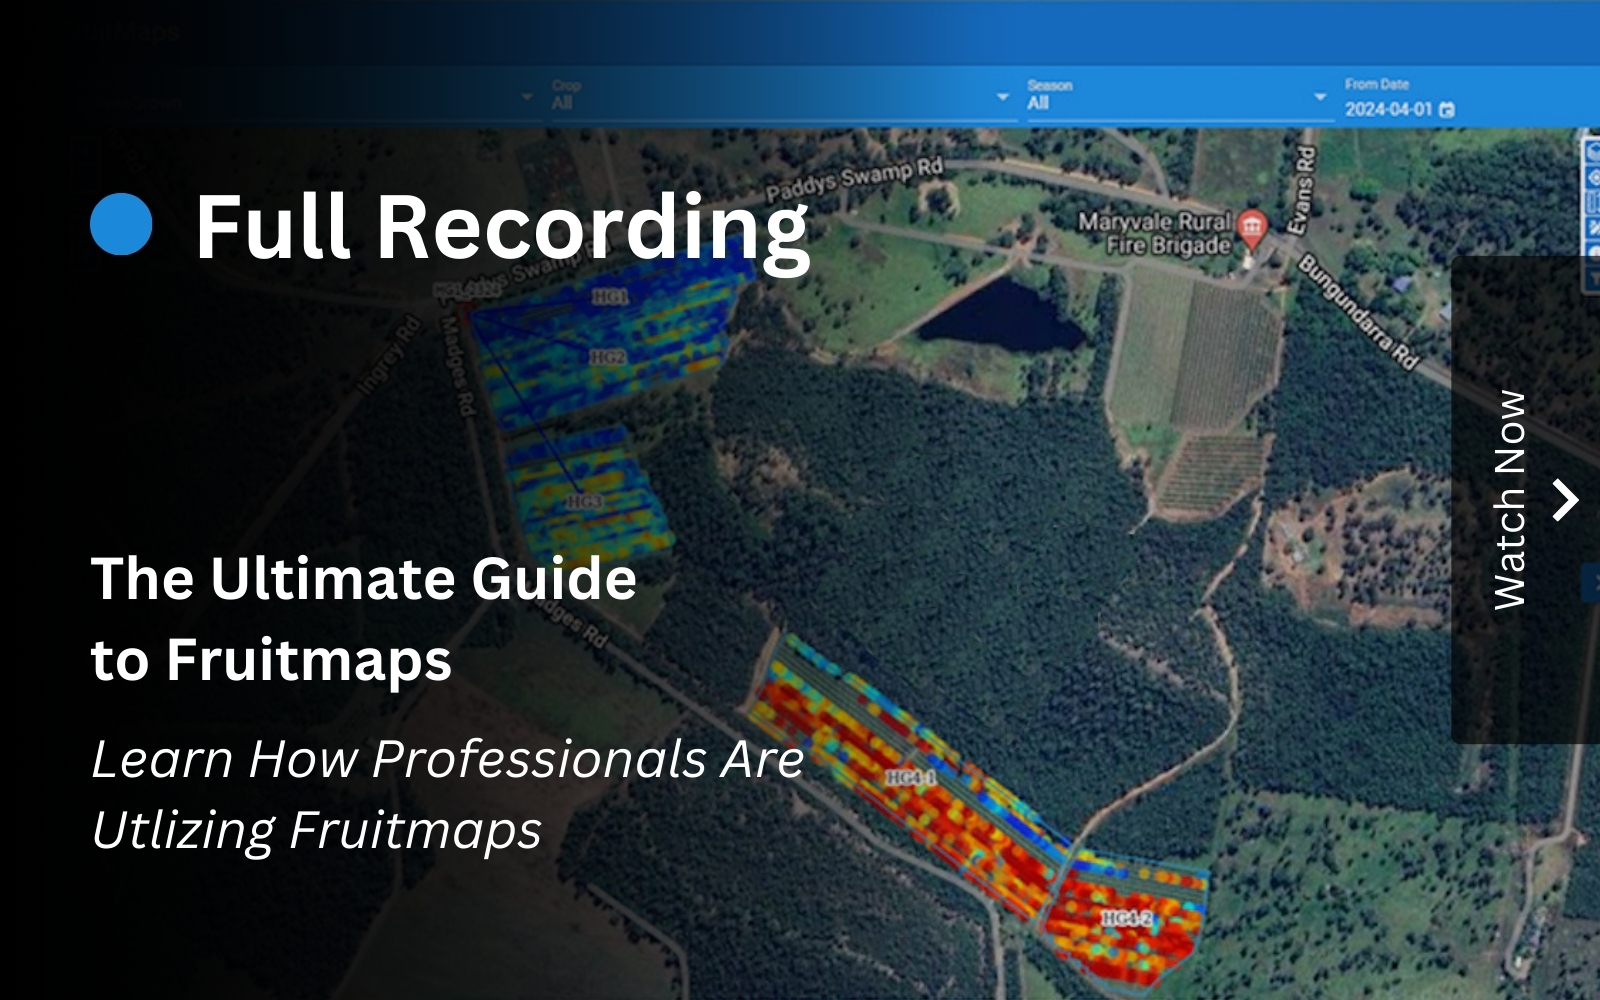
so yours may or may not have data when you first open it but this is the kind of homepage for fruit Maps it’s going to
be on this satellite image remap and there’s a lot of different components here so I’m going to walk
through just this homepage first and tell you what everything is so first uh we have this top toolbar here anytime
that you change a parameter or try to load new data or New Seasons or anything
like that you’ll see a green loading bar going across the screen so that green loading bar is indicating that that new
parameter is being loaded in all that new data is being loaded in and so that’s how you can see the progress of
how that’s doing this next toolbar on the top here is going to be where you can select the
farm that you are looking at for a lot of you it may only be one farm so you might not see a drop uh any other
options in your drop down menu but if you have multiple Farms you can select your multiple different Farms from this
dropdown from the crops section here you can actually go through and select any
kind of different crops if you happen to have one farm that has multiple different Commodities like mango and
avocado or something like that then you would be able to see all those different crops here this is a mango Farm
obviously so or mango Orchard so you can see that there’s a bunch of different varieties of mango in here and then in the season section
that’s where you’ll be able to select uh what season you want to look at as far as what data you want to actually uh
visualize here on the map so you can choose what season you’re in and then over here we have the from and the two
date these can actually help you see historical data or newer data so right now I have it set to the 2020 season um
because that’s the data I want to be able to show you guys to help visualize with all of these different uh features are but you can change this to and from
date to uh help you visualize different seasons and if you set it to a really wide range then if you come down here
this scrolling bar will actually show you the different dates that data was
collected and you can actually change the range of data and it’ll change how many data points are visualized so like
right now I just changed it down so there’s only two data points uh or two days of data collection that have
occurred you can see that only some of the data here is populated but if I scroll all the way over then it gives me
all of the information that I need so that being said that’s the top
toolbar on the right here are the layers of the map so the block is the actual
outlines here of each block within the orchard they’re all named so there’s hg1 hg2
hg3 these are all parameters that I’ll show you in a little bit how to set those on your farm but these are all
boundaries that are Set uh polygon boundaries in order to allow you to manage your orchard uh in a more
effective way so if you uncheck this then I won’t see those blocks anymore so I’m going to leave that checked the next
uh layer that’s down here is the sensors and so you might see over here uh on the
top of the screen I’m going to zoom in on it you can see one here keep 2 325 and then if
I move back down you’ll see another one over here hg1 2324 so these sensors are
uh temperature sensors and there’s another one at the very top of this map as well hg5 so those are the sensor host
temperature sensors um that are linked to various numbers of blocks and that’s
what’s feeding that’s what’s receiving all that temperature information and feeding it into the Harvest forecast
engine now you might be wondering okay so it’s in the corner of these blocks I don’t really know what temperature it’s
collecting for well if you collect this sensor block linkage button you’ll see
these blue arrows going out from the temperature sensors and that’s telling you which blocks that this sensor is
collecting data for so you can actually visualize and see okay I know this temperature sensor is collecting data
for hg5 top K and home R2 E2 so those
are the sensor block linkages that you can visualize and if you uncheck that then those blue lines go
away this fruit layer uh this is going to be determined based on which of these
different components you are selecting at the bottom to visualize right now we’re on the internal quality which is
the F750 F75 data for dry matter uh and so with the fruit layer here on
the right side we can actually see that there’s a chart of different levels of
dry matter and different levels of dry matter give you different colors and so
that’s how we can visualize when things are starting to get to our threshold which is 17 so anything greater than 17
that’s ready to be harvested is red anything that’s less than that is going to have a varying degree of color and so
if I put this back like I did originally and we can see here that
earlier on in this in their data collection in this 2020 season that only a few of the uh mangoes that they
measured were actually ready to be harvested and the rest were almost
getting there some were in the 14 to 15 some are in the 15 to 16 16 to 17 so they’re starting to get close but not
quite ready but as they progressed in data collection if I scroll all the way everything’s r everything’s ready to be
harvested at that point so that’s how you can visualize on a specific block
exactly when things are are are ready or even looking at things like distribution
of where in your specific block are things starting to mature faster than other fruit uh or are there certain area
certain blocks that are performing better than others that are maturing faster or slower than others so this a
great visualization tool now going back down this Bottom bar
I mentioned that we’re in the internal quality section right now which is all of the dry matter data if you click any
of these other parameters down here like flower count fruit counter fruit size
it’ll just change the VIS visualization of this data so it no longer will be dry matter data it’ll be fruit size data or
it’ll be fruit count data or flower count data so all those different layer all these are essentially different
parameters different data inputs uh that are going to be able to be VIs visualized on the map just like we are
visualizing this dry matter content on the left side here is where
all the different functionalities come in and I’m going to start actually with the bottom just to show you guys the uh
really helpful feature here if you are just getting started with fruit Maps or even if you’re an experienced user and
you are a little unfamiliar with the new platform this help button is going to take you directly to a user manual so if
I open this we’re going right to a user manual that has everything linked all the different
steps that you could possibly need user interfaces how to create your farm how to manage your data and visualize your
data so all that information is available right from the website just by clicking this help
link if we go to settings this is where uh if you are a
owner of a farm or uh if you are I guess an admin like me you can invite
different types of roles to also join in in helping manage your fruit Maps
platform so the way that we have this structured is it’s kind of a hierarchical system so we have a top
person who is an owner and that owner of the farm is able to then send invites to
managers or Consultants or marketers we have these three different roles laid out each role has limitations to what
they can or can’t do managers are able to do pretty much everything an owner can essentially besides invite people
the manager is able to upload data pull reports uh manipulate data do all sorts
of things and so the man and change the Farms add new blocks things like that so
the manager level is some that someone that the owner would want to invite who’s a upper level uh person that kind
of manages more than just uh the you know a single you know Orchard might have multiple Orchards or something like
that consultant role is someone that should have access to the farm to be
able to upload data but doesn’t really have uh much more access than being able to upload data and pull reports and then
the marketers are only able to see uh the final uh uh data that’s exported the
actual an analyze data from the forecast engine they just get the final data
reports out of that and so this being invite only system how it needs to work
is that if you want to utilize this system you need to have your farm owner
sign up and then have them invite the other people that are going to be actively using the fruit Maps within
their organization so every organization will have an owner and then various other people in these other roles so
that’s this section of the settings where you can invite people the farm section is actually where you’ll go to
set up a farm to change and add sensor locations to create your blocks within
your farm to set up what kind of crops you’re going to be uh actually measuring
in your Fields the varieties of those crops um and then also things like you
can do things like uh upload specific images of trees and fruit to help with
the fruit sizing and and determining number of fruit per trees and things like that down in the configuration section
we have two really uh big important ones here are the Harvest load parameters and the dry matter parameters so if you’re
doing the other inputs things like fruit size fruit count flower count this
Harvest load parameter section if we go into here we can actually change things like the unit weight of the fruit the
Harvest capacity the Harvest tolerance the field bin size and that all will go into the calculations for your uh
Harvest uh forecast and so that all is important data that you’ll need to input if you’re utilizing those
features now if you’re just using the dry matter like what we’re talking about
today then here’s where you would input that dry matter Target and you can set things like dry matter increase you can
also do things like block to estimate rate of dry met increase from so you can actually instead of uh you know
dictating what your dry matter increase is going to be you can estimate that
based on a specific block that you’ve already been measuring use that as your kind of template
block um and so that’s where you would input all these values in order to get
that Harvest forecast that we were showing you to reach that Target dry
matter so as I mentioned uh this is where you would set up your farms and stuff I just wanted to really quickly
show you the blocks um section of this so if you go into blocks you can
actually view all of your different blocks that you currently L have you can change the number of blocks that you’re
viewing so if we wanted to view all 15 then we just change that records per page value and now we can actually see a
table here of all of our different blocks our sensors the the numbers of the sensor the area of the actual block
the number of rows trees all this stuff is stuff that you would input into the
system when you go to create a new block so if I were to add a block here what’s going to happen is you’ll see that we
have to name P it we have to add our crop we’re going to actually go ahead and we can dictate
the coordinates of the block itself and we either can do that by uploading uh so
we can actually read a polygon from a CSV so if you actually input coordinates from a CSV you can do that or if you
have like really precise exact GPS coordinates that’s what you would want to do or you can simply draw a polygon
so if I drew a polygon it would look something like this I’m clicking buttons I’m doing one
click of the mouse and I’m creating a polygon right so now I have a new block
right here that’s uh just a random patch of forest but it is that’s how you would
go about drawing new blocks if you don’t have any kind of coordinates that you want to that you can manually upload
here so we’re going to go ahead and cancel out of that because we’re not actually adding a new block but that’s how you would go about doing that um and
then the farm is kind of the same exact process without having to add your blocks first it’s just defining all the
parameters of your farm ahead of time so that it’s much easier for the Harvest forecast engine to do that data
analysis so from here we have a couple other options uh not all these options
are going to be visible and available depending on your role um so the ones that I’m going to focus on are things
like manage uh so manage uh in this section is where you can upload data so you can
actually manually upload data instead of if you you know if you were doing manual fruit count or fruit sizing or flower
counts you can upload that also uh say you don’t have internet access and you can’t wirelessly upload your data from
your F750 or your F75 then what you would do here is you would just W uh uh go to your back to
your computer at the end of the day and you would upload your dry matter in CSV or text file format um and that would
allow for the the actual Harvest forecast engine to go and take that data and put it into the map visualize it and
put it into your charts and all of your forecasting um analysis so there’s always that backup option if internet
access is a issue for you the
next thing I’d like to look at here is the chart section and I got to go ahead and change my range back because I went
to a couple different menus here but if I change my range to the range we were
looking at earlier the 20 2020 season then what we should see
is some data for a specific block so if I choose
hg1 from this drop- down list we’ll be able to see all sorts of different graphs so in this particular uh Farm
what they were doing was collecting all the data that I’ve mentioned so they have everything from the temperature
from the flower count fruit counts all of that stuff so we can see here uh the temperature time course we can
see the heat units chart so they’re B looking at their actual heat units and when they’re going to be able to heat
reach that Target heat unit value we have the distribution of fruits by fruit
size the fruit size time course so we can actually see how the fruit size has changed over time we have the
distribution of flowers per tree the time course of the flowering the
distribution of fruits per tree so that’s critical information to input when you’re setting up your farms and
your blocks is the number of trees so you can actually see this distribution of fruits per tree chart and then at the
end here is what we’re interested in is this actual distribution of dry matter
and so what we can see is that we’ve got you know a few fruits that are a little bit you know in the immature range 12 to
15 range 15 to 16 there’s 12 fruit that are starting to get close to maturity 16
to 17 they’re just about at maturity five of those fruit and 41 fruit that are over that maturity threshold and we
can actually see here in this chart at the bottom left this is our forecasting
and so this is the red line here is our Target dry matter of 17 and it’s telling
us exactly when that optimal Harvest time is going to be reached so 2020 of
or uh sorry December 18th of 2020 is when that 177% threshold is was going to
be reached for this specific block remember we’re in a block level so in Block
hg1 on December 18th that’s when Harvest uh can be you know begun and so this for
casting engine is going to help you with determining that exact specific date and it’ll change depending on the Block that
you are measuring so really useful information lots of good data here all
of these graphs can be exported everything can be exported um you can also download the actual
image uh if you want to use it in like a presentation that you have to give to stakeholders or something you can view
it in full screen to get a bigger image um but yeah so that’s exactly how we would go about looking at all this data
that’s been analyzed and put into chart form if we go um moving up this uh bar
on the left here we have the Harvest load calculation so this is if you’re doing uh the flower count the fruit
count all that stuff uh you would go into this menu uh we have a dashboard view here so in the dashboard view uh
it’s really just showing the yield by week and it’s just like a really quick overview of uh the changes of yield over
time the block summary table is going to show you and as you can see this bar is
loading the green bar as I mentioned before but and the block summary table it’s just going to give you an idea of
all the most basic details of of that block so the area the fruit count the
yield and then the number of bins um for those different uh blocks and then with the map feature we
have two other kinds of visualizations that are map based you’ll see this swipe
and compare so the swipe map is actually going to allow
for you to see two different kind of uh uh time ranges and you’ll be able to
actually swipe this over and see changes over time using this kind of swipe
feature over different seasons um whether there be Seasons or different uh
parameters you can swipe to see different parameters um and so you can actually see like we could visualize
something like uh dry matter data and then go and look at flowering so I’m
going to go reset this again to the
2020 and we should get some visualization here in one second if I
change this to
2021 then we should get some visualization but regardless there is uh
the ability to essentially change between parameters um and view the the the
basically the flowering versus the uh fruit Count versus the dry matter content so that’s a useful feature we’ve
got the compare feature which is just going to show uh basically side by side you can look at
uh two different time zones so you can say the 2020 let’s see 827 to 9 over
look at the a time that’s later 920 or 909 to 916 over here so you can look at
two different uh times at the at two different time periods at the exact same time and that you know is another useful
map visualization but really the most important one is uh the actual
just homepage map where we’re visualizing internal quality data um and
that’s uh essentially going to be the most useful aspect of this of this chart
so that is the rundown of fruit maps and you know there is obviously a lot more
in depth you can get into it um but if you have an interest in this software then we really highly recommend you
reaching out so we can actually get in touch with you you and um walk you through give you a nice U you know a
more thorough walk through and actually potentially so that up a demo account for you or something like that so now
I’m going to switch back over to my
presentation just to say that was our first look at our brand
new fruit Maps software we’re really excited about it everything is looking really great we’re really excited to see
some more uh use of the software platform um especially in other Industries besides mango if you have uh
specific application questions if you have a a certain crop that you’re working with that you aren’t sure is
appropriate for this or if you have some kind of uh questions regarding the
freelance robotics fruit count flower count uh software the Orion software or for the sensor host temperature sensors
uh Susie will post links in the chat to their websites um but if you have any interest in utilizing the dry matter uh
uh instrumentation the F750 and the F75 for fruit Maps integration then please
reach out to us you can click this tiny URL um which Susie will also Post in the
chat that tiny URL will lead you to a landing page to be able to get more information about our produce quality
meters for a non-destructive and rapid assessment of internal quality traits like dry matter bricks and TI trable
acidity it’s integrated full f with fruit Maps so all it takes is two clicks of a button to wirelessly upload data
directly from a device into that fruit map software completely integrated so very uh you know user friendly no uh um
no sort of extra steps really involved at all so all that data can be just streamlined right to your platform right
to your farms and your Orchards and your blocks so we’re really excited about this if you want to contact us please go
to our website um you can sign up for newsletters we have a lot of great content on our newsletters uh all sorts
of new research that’s being published we’re highlighting all of that we’re highlighting news in the industry we’re
highlighting news with our own product development um you can also go to our LinkedIn page we that’s where we post a
lot of our newsletters as well and then our YouTube page is full of great tutorials and other webinars that we’ve
done in the past so if you want to learn more about our F75 or F750 quality meters feel free to check out our
YouTube channel for that and then also uh you know you can always just email us
directly or give us a call and we’re happy to talk or chat about your applications or your interests um with
that being said I’m going to go ahead and jump into the Q&A section of
this uh so the next question is uh or the first question is the F750 and the F75 may also be used to determine the
optimum temperature and optimum pH so as far as what spectroscopy like
spectroscopy based devices are capable of you can certainly measure PH with the F750 and the F75 temperature uh you
could also technically uh um measure temperature with uh that but you we
would have to build separate models most of our models that we build don’t include those as units of measure um
within the model itself so you’d have to build your own models for those but it certainly is technically capable of doing both those things we have modeled
pH very successfully in the past with things like berries and other commodities
uh the next question is is there any facility to store data of individuals Farms years wise or any other identity
to save the data so the fruit map software is going
to save all your historical data you you’re going to be able to view all of your data from previous years previous
Seasons all that will be stored in our uh server so our Amazon web server based
uh uh server is going to store all that data so you’ll be able to actually see performance year-over here that’s one of
the big benefits of having a harvest management information system like this is being able to change your practices
or or see how different changes in agronomic practices are affecting your
final bottom line your output and so that’s uh something that’s going to be
an invaluable tool and big aspect of this software so yeah well all that data is stored um by this the platform
itself um the next question is is the data transferable to another
device as far as if you’re wondering about data from a
F750 uh so the F750 the data isn’t
really useful to be transferred to another F750 device if you’re referring to data from the fruit Maps platform
being transferred to another device I’m not sure if I can answer that either I
know that you can view the vabs website on pretty much any platform but I’m not really I guess 100% clear on your
questions so I might have you just reach out to me directly and and expand on that further because I’m not 100% sure
what what you’re asking there our next question is does the
device require specific software to store open and process the data no so
the um still kind of unclear what you mean by the device I’m guessing you’re talking about the 750 or the f 751 but
if you’re not then please reach out to me so I can answer these questions a little bit more specifically once I get
some more clarification but if you’re asking if the F75 requires specific software to store open and process the
data then technically it it does but it all that software is on the device it’s
it’s included with the device itself so being able to take measurements in the field get immediate response of what the
dry ladder bricks pH table acity whatever they are uh and within you know a few seconds and
then having that data being stored on the device and able to be sent wirelessly to fruit Maps that’s all part
of how the device operates so it’s it’s included with that device but if you’re referring to fruit Maps then fruit Maps
is an open web platform so you can view it on any any other device that is able
to open a web browser it’s just a web browser based uh device or app
the next question is what is the process of entering data from instruments that aren’t already integrated so that’s a
great question so in the past how we how it worked is that you had to register a device in order to have that data be
uploaded to fruit maps.com that is no longer the case so the uh current
platform as I mentioned is a hierarchical system so we’re actually have an owner that has to invite people
to the fruit Maps software so once you have an owner they can invite people but
there’s no ability to just register an account uh without having an in
invitation at this point so that is how we are removing the ability or the
necessity of having to register devices because now that only certain people are going to have access to their Farms on
fruit Maps any device that is taking data within GPS coordinates that are
within a block so if you took a measurement and it’s within a block in a farm that data is going to be uploaded
to that block and so no matter whether or not it’s registered or not so all
instruments are already compatible and integrated with fruit Maps as it exists right now the new the new version of it
so there’s no more need for that which is a really uh useful I think feature that we built in so we’re still
protecting data Integrity but we’re not we’re uh not having to put people through jumping through the Hoops of
always having to make sure that their devices are um I guess registered with our system so now any device that’s
within the boundaries of a block within an orchard when that data gets acquired
if those GPS coordinates are within that block boundary that and you upload it to fruit Maps then it’s going to go right
to that block boundary it’s going to associate exactly with that point where it was uh acquired with the
device uh the next qu uh next question is just a comment from Felix Moser uh
thanks scaling great software looking forward to using it again next year uh Felix uh we’re always happy to to
have you using the software and we’re looking forward to you using it more as well in the future um and then the next question is
will it be useful in India I think this is useful all around the world uh especially if you’re doing mangos in
India this is already a system that was uh built and developed thanks to our partners at Central Queensland
University uh with a big focus on Mango um and so we’ve got a lot of features
already built in for mangoes specifically so if you are using this in India even if you aren’t using mangoes
then it’s still going to be a very useful platform anyone that is trying to man more uh I guess data do more data
informed decision- making manage their Orchards manage their farms in a more data driven way then this is going to be
a very useful platform for them so yes I do think it would be very useful in
India and that’s all of our questions so if you do have more questions then please make sure that you reach out to
us directly you can email us like I mentioned you can call us if you have specific application questions I’m more
than happy to answer those for you and make sure that you are uh utilizing this in a way that’s going to benefit you um
and your organization um so yeah thank you very much and everyone have a great rest of
your day jayen oh there’s one more uh it was more
of a comment on in the question that just popped up in the question oh okay I’ll open it up really quick Let’s uh
the next question is see some real potential in bananas and pineapple okay
well yeah so if if you see a lot of potential in a commodity that maybe is not utilizing something like Harvest
management information information systems uh very regularly then I really highly encourage you to reach out to us
we can set you up uh or the owner of uh your farm or if you know people that
could benefit from this please send them our way and we’re happy to set up consultations with them so that we can walk them through exactly how this might
benefit uh them and especially if it’s in a commodity that’s uh you know not typically using this these kind of data
driven decisions then that would be um really awesome to see so yeah thank you Gerardo for that
comment all right and thank you everyone again for joining and I hope you learned
a lot and we’re excited for more people to be utilizing these kinds of systems and data driven insights in the future
so please reach out like I said if you have questions uh about utilizing fruit Maps or you would like to start using it
then just reach right out to us and we’re happy to help have a great day everyone