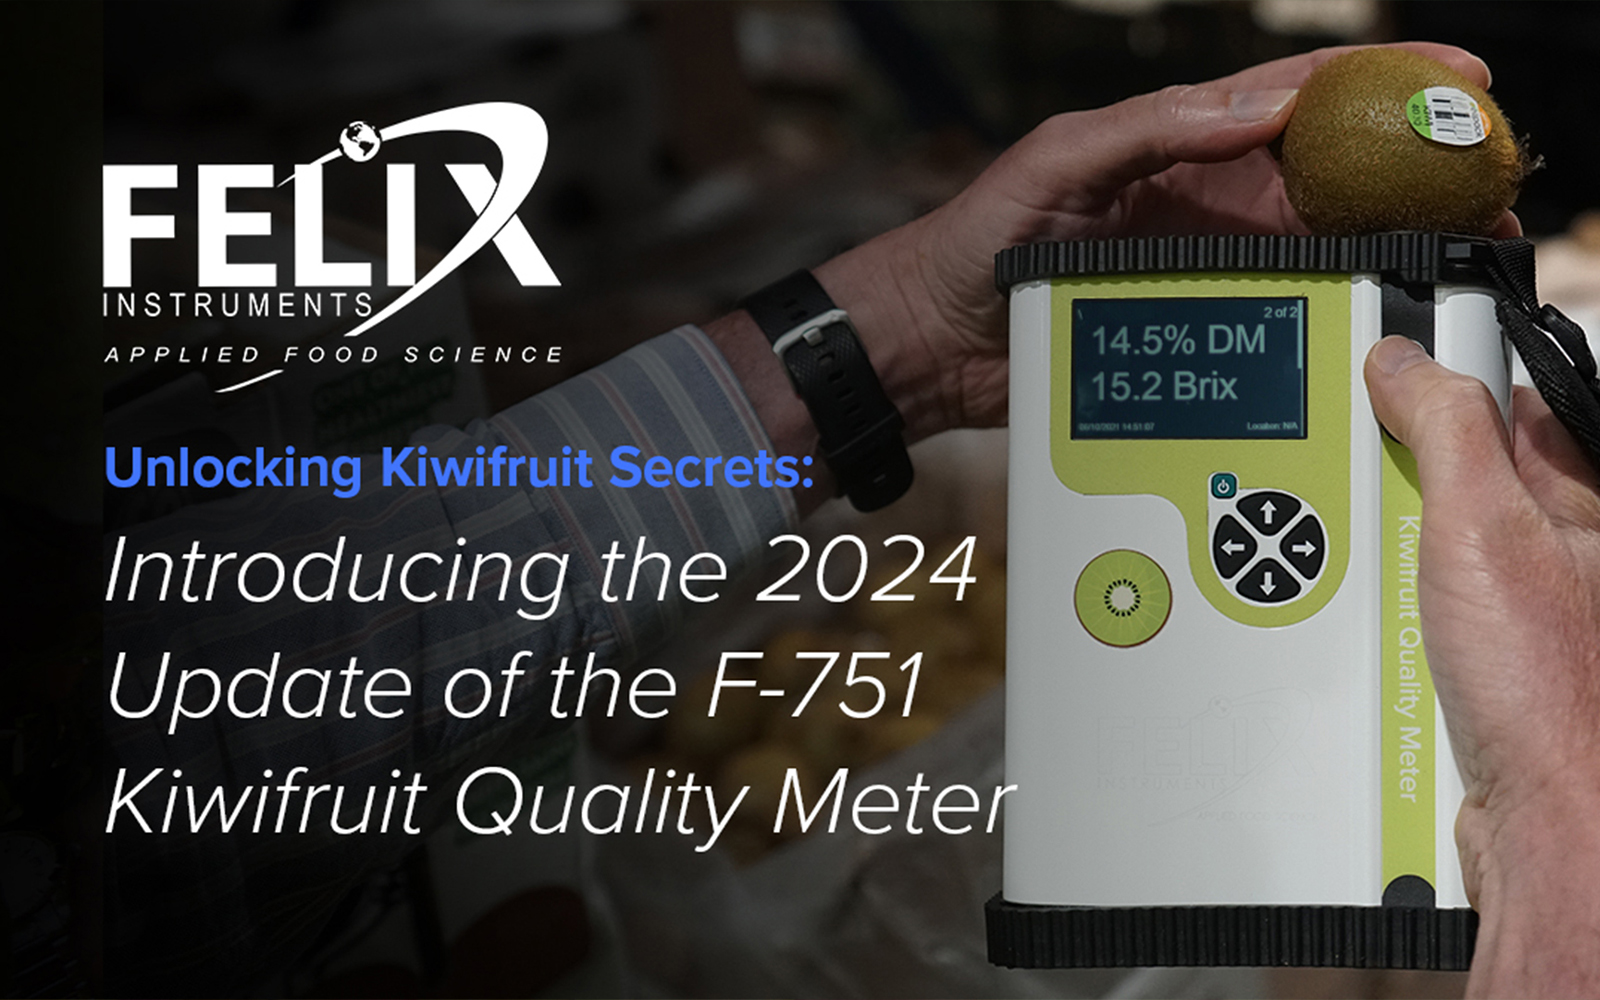
Unlocking Kiwifruit Secrets: Introducing the 2024 Update of the F-751 Kiwifruit Quality Meter
Hunter Weber
April 8, 2024 at 6:40 pm | Updated June 4, 2024 at 9:35 pm | 22 min read
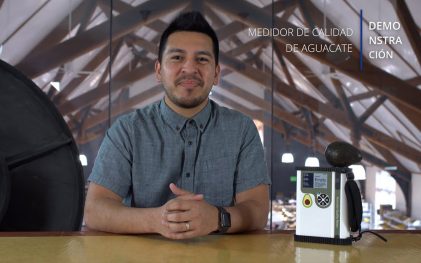
Dive into the heart of food quality technology with our recent webinar, spotlighting the groundbreaking update to the F-751 Kiwifruit Quality Meter. Hosted by Galen Geroge, our Director of Applied Science at Felix Instruments. This session is a must-watch for professionals and enthusiasts alike who are keen on the latest advancements in food quality assessment.
Why Watch?
– Learn Directly From the Experts: Galen brings a wealth of knowledge, sharing insights for the F-751 Kiwi Meter’s latest features and applications.
– Engage with Innovations: Discover how updated technology sets new standards in food quality and safety, significantly impacting the industry.
– Interactive Q&A: Benefit from a dedicated Q&A session where our experts address your questions and offer personalized insights.
– Practical Information: From technical troubleshooting to accessing additional resources, get practical information to enhance your understanding and use of the F. 751 Kiwi Food Quality Meter.
Links discussed in this webinar:
Slide deck:
https://cidbio-my.sharepoint.com/:p:/g/personal/ggeorge_cid-inc_com/EV4Fx9FqpjxGvxjYpVFhglAB4hS8mDhmJkFEmL3XERa4WA?e=rlz8V8
Validation report:
https://bit.ly/3Jb2K9W
Chemometrics Series:
Video Transcription:
All right.It is 4:00 pm on the East coast
of the United States, where I am.
And it is 9 a.m.
in Auckland, New Zealand,
according to my iPhone.
So welcome, everyone to today’s webinar.
We’re really excited today
to talk about the update of the F7
51 kiwifruit Quality Meter.
Before we get started,
I want to just cover a little bit of light
housekeeping today.
Our moderator is Hunter.
He is our marketing coordinator
at Helix Instruments and City Bioscience.
Hunter is going to be the one
that’s moderating the chat.
He’ll be posting
any kind of relevant links.
so if there’s any links
in the presentation,
he’ll post those in the chat
so that you can click on those.
You’re not gonna be able to interact
with them on my presentation.
So that’s where they will be.
If you guys, need to communicate with us,
that we’re having technical issues,
if you can’t hear me, if the video
goes out or if the presentation goes away,
please use the chat feature for,
for those kinds of, notifications.
If you have questions that pertain
to the actual content
of this presentation,
then please utilize the Q&A function
at the end of the presentation,
I will be opening up that Q&A function
and going through all the questions
one by one and answering those.
So if you post your question
into the chat, then I likely won’t see it.
And I won’t be able to answer it.
But always
be, you know,
aware that if you do have questions,
if you think of questions after this,
or if you had a question that got lost in,
in the mix, then please just feel free
to reach out to us directly.
And I’m happy to answer any questions
after this presentation, through email
or through a video call
or or anything like that.
So for any of you that aren’t familiar
with who I am, my name is Galen.
I am the director of applied science here
at Felix Instruments.
I’ve been with the company
for five years now.
My degrees are in biochemistry
and food science.
I’m an AI certified food scientist,
and my background is mostly in quality
and safety assessment in the food,
agriculture and cannabis industries.
And what I wanted to do today
was a little bit of a departure from
from what we’ve done in previous webinars.
If you haven’t joined one of our webinars
before.
one that kind of goes along with this,
a little bit that you might interest
you is our whole series on key metrics
and modeling and how we actually do
the modeling process for,
these devices, the at 750 and the 751.
but what I wanted to do
today was just kind of
give you some background on our company,
in case you aren’t familiar
with who we are.
So we are Felix Instruments,
and we were established in 2012.
we are a, sister company or a subsidiary
company of Seed Bioscience.
And so CED Bioscience
was, founded in 1989,
and it started as a company
that created nondestructive research,
scientific research tools for plant
research, and plant phenotyping.
and so we’ve what we’ve done in since 2012
is we’ve applied that knowledge
that we gained over,
catering to plant researchers
in the agriculture or in the ecology,
and the environmental sciences,
kind of, realms.
We’ve taken that knowledge and we’ve
applied it to this new technology
that’s near spectroscopy technology
to help us create these cutting edge,
nondestructive tools for the produce
sectors of the agricultural industry.
And the way we’ve done that,
we’ve we’ve been able to do this,
basically this innovation
through collaboration with top researchers
and industry leaders across the globe.
And so we really want
to make this technology as,
with a global approach in mind and,
and everything that we do,
we want to make sure that it caters
to regions all across the world.
And so that’s what
we’ve taken as an approach.
And the other thing that to note
is that everything we do,
all the engineering, the design,
the manufacturing, the research,
everything takes place
in-house at our headquarters in Camis,
Washington, in the Pacific
Northwest of the United States.
we the way that we actually are able
to access all corners of the globe
is through our distribution partners.
And so we’ve got distribution partners
worldwide that allow,
anyone, anywhere
to access our technology,
and also give them localized
support and sales, help.
And so they’ll in New Zealand
specifically, we have Mac solutions.
they’re based in Christchurch
and they are, a company
that’s very familiar with
and our technology,
they’ve been dealing with that
for a while.
And they also have a lot of expertise
in the food industry
and shelf life testing
and things of that nature.
And so they’re our local distributor
for New Zealand.
and the other aspect of this is
that New Zealand isn’t the only region
we cater to, obviously.
So we actually have devices
that are deployed over
to over 500 companies and or 500 customers
in over 100 different countries,
and we have features in over 200
different peer reviewed publications.
And so these devices
have been really tried and tested across,
multiple different regions
and, and across time
to, you know, really become the robust
technology that they are now.
And the technology that I
referring to in that whole section
was the F7 50 and the F7 51.
So these are our near infrared
spectroscopy instruments.
They’re portable quality sensors.
And so what that means is we’re using near
infrared spectroscopy in combination
with a robust key metric calibration
to enable users to acquire data
nondestructively of internal
through quality indicators.
So we’re shining light in the visible
and near infrared spectrums
into the actual muscle car
tissue of the fruit.
And we’re getting information
about the chemical constituents
and the physical chemical properties
inside of that fruit without having
to actually cut it open or do anything,
any kind of destructive assessment.
And so this technology really is
a combination,
a marriage of the hardware aspect,
the actual spectroscopy
kind of aspect of it.
But then there’s also this really complex
process
of of creating these keemo metric models.
So that’s kind of where
we have to find this balance
and where we find most of the improvement
coming from,
in recent
years is on the key metric side of things.
And so that’s what
we’re going to be talking today about, in
later slides is I’ll be showing you
how we’ve improved the actual quality
of the models themselves with the,
kind of actions that we’ve taken
to increase, our data flow.
But before we get there, I
also want to just kind of lay out
why you might be interested
in this technology, what kind of benefits
it can provide to you.
So the very first thing I’ve already
mentioned this a couple times.
I’ve said this, this buzz word a couple
times is that it’s nondestructive, right.
We’re eliminating food waste.
For one thing, we’re eliminating
the actual waste is for it
in the form of the cost of the produce
that you’re destroying
when you do your quality testing.
But then we’re also enabling you to go out
and take measurements
and take as many measurements as you want,
without having to worry about,
you know, wasting that fruit
and not being able to monitor it
again at a later point in time.
So it enables you to actually see
progression of these fruit traits
in the same exact fruit over time,
which is something that’s really unique.
And and at the current state,
with the technology
and the destructive methods
that are being used, is just not possible.
So that’s one benefit of this,
this technology.
The other is the accuracy. So
right now
we have the ability to utilize
in this great age of technology.
We have, AI and machine learning methods
that we can utilize
to actually improve
the performance of the models.
So this technology spectroscopy
has been around for a while,
but we also haven’t really had the,
I guess, the software
kind of AI technical capabilities
to make these giant kind of data,
you know, databases
that allow us to incorporate tons
of different variability
and allow AI to learn
how all these different little variables,
things like regionality, seasonality,
temperature, variety,
all sorts of different, you know,
what stage of maturity the fruit is at all
these different variables.
The models now can learn
how these different variables impact
the actual spectra that’s received by the
instrument, and allow us to incorporate
and build all those different variables
and build these more robust data sets.
And so the accuracy is improving
because we’re able to actually use it.
The technology
and a wide variety of situations now
and not be worried
about whether or not it’s going to be less
accurate or more accurate
in this situation, because we’ve built up
this large database, whereas in the past
and I our calibrations are typically
very specific to a singular, you know,
condition, environmental condition, it’s
very controlled kind of in conditions.
But this allows us to use it
in a variety of applications.
And that leads us to the versatility.
So these instruments
can be used out in the field.
They can be used in the pack house
at the retail outlet.
As an importer
you can use it to inspect incoming lots,
all sorts of different applications.
Really
any point in that food supply chain.
And the reason we’re able
to do that is because of these
really robust data sets.
We’ve also integrated some features
into the device itself to allow for
compensation for different lighting
conditions and things of that nature.
So we’ve got this great marriage of
we know we can deal and compensate
for all these different variabilities
that might be present
in your specific situation.
So what we’re trying to do is create this,
this product
that works for everyone in any situation.
And lastly, what this can give
you is just a wealth of insights.
This technology,
because it’s nondestructive,
because of all these things I mentioned
before, it allows you to go out and
and rethink how you sample.
So and you know, and traditionally
we’re sampling as little fruit as we can
while
still trying to maintain representation
in our sample set.
But the reality is we’re never going
to be able to hit that representation
mark, because we’re always
going to be encouraged to reduce our ways
to reduce our costs of testing,
our costs of wasting fruit.
So now with this technology
allows you to do is go out
and actually sample as many fruit
as you want to try to get
as a better, more representative idea
of what’s going on with the fruit
that is in your field, in your orchard,
or the incoming fruit
that’s coming from the orchards
or whatever you’re importing.
All of that allows you to go out
and sample more and get a
and be more informed, essentially.
So this technology
has been really groundbreaking for
for the agricultural field
because it’s just it’s it’s a total
change up to what we’ve been doing for the
last, you know, 30 years now.
So when
I’ve been talking a lot
about the modeling,
and I haven’t really explained too much
about what goes into that modeling,
besides, we’re building a big data sets
and we’re we’re adding a whole bunch
of data from different regions and seasons
and things like that.
But I wanted to give you a specific
look into how we’ve been developing
these models in beach.
And as transparent as we can.
So specifically for New Zealand,
what we’ve been doing is, working really
closely with a independent third party,
collaborator of ours called Start Afresh.
And so they are a totally unbiased,
independent,
unit that is actually investigating
multiple
different kinds of spectroscopy
pieces of equipment.
and in that we were a part
of that kind of investigation.
And this started back, in the earliest,
data collection was back in 2020.
So at the F7 50 and the F7 51,
we were, started
fresh, was helping us to collect
both spectral data and reference data
using the current standardized methods
for reference testing, from,
you know, early season
through to, you know, the harvest stage
and even some post-harvest data.
So from 2020 all the way now through 2023
and continuing on in 2024,
we’ve been collecting data.
And in 2020, we just did gold in green.
And in 2021 is when we started collecting
red kiwi fruit data.
So right now in this updated model,
we have four seasons
worth of data in the gold
and the green models.
And we have three seasons now
worth of data in the red kiwi fruit.
And I’ll show you the impact that those
have towards the end of this presentation.
But there is some significant
differences that you’ll see,
especially in the red kiwi fruit
now that we’ve added in a third season.
so just something to note
how we built the models.
I will also mention later,
but New Zealand isn’t
the only region that we’re catering to.
It is just, you know, one of the largest
kiwi fruit growing regions in the world.
And we are, you know, collecting
massive amount of data from them.
But we do have data from other regions
in our model as well,
which I’ll mention later.
So I want to get
into the nitty gritty details
of of exactly
what performance looks like and how we
measure performance of our models.
And I want to explain this graph
the statistics to you and everything.
so let’s just start off
by going with the table to the right.
I’ll explain
some of the statistics to you.
And from there
I will explain what this graph means.
And and kind of how we interpret
this graph
that we and that we, that we create
and how we actually even created it.
That being said, I’m
not going to go through
we have an entire internal validation
document that I’ve put together,
that goes through
every single model that we have.
And so if you want to view that and review
all of the different models
and look at all these performance
statistics that will be available
for download online from our website,
if you so.
But for the sake of keeping
this presentation, not, you know, 2.5
hours long,
we are going to only focus on a few of the
we’re going to
I’m actually
just going to focus on dry matter
for gold, red and green
and just kind of show you an example
for each of what we did
for our validation testing.
So in a validation, what we’re doing
just kind of some background
of in a validation,
we are taking a small subset of data
from the most recent season, 2023.
And what we’re doing is we’re removing it
from the model training set.
So the data
that’s actually used to create the model
where we’re taking a small subset
of data out of that.
And putting it aside, and we’re building
the model independently.
And then we’re going to take this data
and we’re going to test it
against the model and see how it performs.
And so that’s what we’ve done here.
And I’ve split it up in a way
that we’re actually looking at the two
different instrument types
f 750 and f 751.
And we’re comparing those performances as
well as looking at the overall accuracy.
So in the table we’re looking at
we have the average for the data sets.
The standard deviation.
And then we have the Rmse CV
which is the root mean square
error of the validation set.
And so this statistic
is very important to us.
The Rmse CV is
to be considered
essentially the average error
that you can expect.
So imagine if you see a statistic
in a publication that says, you know,
we’re confident that this prediction
that this, reading
was 1.0 plus or minus,
and then there’s an error
that’s kind of what you, what we interpret
this, value can be interpreted as.
So Rmse is what you would consider as the
error of the instrument, the r squared.
Most of you you’re probably familiar
with the r squared statistic.
It’s a correlation coefficient.
and then RPD is a statistic that we use
that is not necessarily
a it’s a it’s a unitless measure.
It’s essentially looking at the,
the Rmse in comparison
to the standard deviation.
So what we’re looking at is, is the MSI
low, is the error low in comparison
to the standard deviation.
And for the RPD,
a value of 1.5 or higher means that the,
the predictions of this of this model
are really robust.
And they, they are
the error is essentially much lower
than the standard deviation.
And so that’s higher
RPD is better always.
So that being said,
if we look at our gold dry matter model
right here, we can see that both the F 750
and the f 751 data sets align
very well with each other.
They’re not drastically different.
They’re they have no, difference in bias.
So there’s not one data set that’s
predicting much higher than the other one
or anything like that.
They’re both predicting very, similarly,
the data sets that we use,
the reference data sets, you can see that
the averages are both very similar.
it’s represented
across as wide of a range as we can,
as we basically can, measure.
So from around a little over
10 to 22 dry matter.
And what we’re seeing is the standard
deviations are slightly lower in our
in the instrument, the predicted versus
the reference method.
But pretty much very similar,
which is a very good sign.
And then our Rmse is
which is what we think
is almost the most critical thing for us
is very, very good.
So we’re seeing very similar performance,
both with an error of,
you know, around .7.66
for that seven, 50.71 for the 751.
So that’s saying that on a given
prediction for a single measurement
that you can expect that if you were to
then take that exact same fruit
and measure
it analytically by slicing the center out,
and then drying it in a dehydrator
and weighing it and finding
the loss and weight,
from during the drying process,
that you would get a value
from that reference process,
you would get a value
that’s within plus or -0.66.
or sorry, I guess reverse of that.
This prediction from that instrument
would be within plus or -0.66 of whatever.
That reference value was so very,
very accurate for our dry
matter models and very similar performance
out of the instruments.
Our, our squareds are really high,
almost 0.9, which means
that we have a really good correlation,
strong correlation in this data.
And our our speeds are all above 1.5.
These are almost at three.
So that’s really, really means
that this is a really really robust model.
For our green
model
we have so it’s the same kind of graph.
You can see there’s a little bit more
spread here a little bit more variation.
and that’s mostly in our F 751.
So the f seven and 51 is around
0.8 for our MSI.
and 0.66 is the same, value
as it was for the gold.
So it’s also at 2.66 IMC.
Our standard deviations once again match
up really well with our reference method.
Our r squared values are very high
still 0.83 and 0.9 for the f 750.
so both of these again
predicting very similarly,
both giving very accurate, results.
And both, you know,
I would trust either of these instruments
to be predicting green dry
matter properties again really high.
And then our red model.
So our red model
now is at a Rmse of around
0.8.78.77.
and so we’re looking at an error,
an average error
that’s much lower than it was.
And last season,
which you’ll see here in the next slide,
R squared is again around 0.9.
I guess I wouldn’t be exaggerating
when I say that these kinds of models are.
This is kind of the ideal model
to see when you’re building models for.
And then I r spectroscopy applications.
these very, very, good correlations
that are on
a, you know, a one, a 1 to 1 slope.
And they’re all really tightly packed
on that line.
It’s really an ideal situation to be in.
So these models have been trained in us
that they are now able
to compensate for all sorts of conditions
because these are a random data set.
So this data contains data that is from,
you know, different fields,
different conditions, different times,
different phases
throughout the maturity process.
So, you know, it’s totally random.
But this model has been able to compensate
for all those variables
and is still able to predict really well,
on a, on a single scan basis.
Now, comparing
where we’re at since last year,
the first thing I want to point out
is that we are essentially stable from
for the gold and green models, for dry
matter and bricks from 2023 to 2024.
Now, this to me is an indicator
that we are at a point where
it’s going to be difficult
to overcome, that
inherent inaccuracies
that are in the reference method.
once you start getting low enough,
you know, it’s essentially impossible
for us to have a zero error
because there’s inherent inaccuracies
in the actual reference method itself.
So for us to be able to
do a error measurement
with the an error
spectroscopy, is just not feasible.
So we’re getting to a point
where it seems like we’re kind of
just in a stable stability,
you know, area where
we’re not seeing much improvement
in the dry matter in bricks.
But we also have now the ability
to explore
even more complex
AI and machine learning methods.
And so what we’re looking at right now
with, some research partners in Australia
and central Queensland is looking
at other types of neural networks,
and how those can improve
the performance of our models.
so what we’re going to see is from here
is most likely
just some more improvement,
but up to a threshold,
there’s always going to be a threshold
that we can’t overcome.
because there is, as I mentioned,
inaccuracy in the reference method itself.
that being said, you know, it’s
really good accuracy that we’re seeing out
of these instruments.
you know, we’re seeing if for bricks even,
you know, everything’s,
you know,
pretty much exactly one or under,
and, for a hue
that was one that we actually did see
pretty good improvement from 2023 to 2024.
So in the gold hue,
you see that we’ve now reduced our
our error down to about 1.2, 1.3.
and so that is a major improvement
from the previous year of two, you know,
being over two, in the accuracy.
So being able to more accurately assess
the internal color
of those gold kiwifruit,
with the devices now,
so the major,
I guess,
kind of revelation here is that, you know,
adding in the fourth season of data
might not have increased the accuracy
significantly for gold and green,
but what it’s doing is it’s building up
that robustness,
that resiliency
to predicting future seasons.
So when this device is now used to predict
for this season or for next season,
it’s going to be much more accurate
and not require
as much updating and fine tuning
and all of those things.
It’s going to be a much more robust model.
And the thing that’s probably going to be
what helps us improve
it is going to be further research
into more complex machine
learning methodologies.
the data collection at this point,
building up a larger
data set isn’t necessarily
going to improve the model significantly
and might allow us to,
get some more representation.
But even then, it’s not going to,
I guess, necessarily
improve the model significantly
in any way.
the big update here
is that the red kiwifruit has improved
pretty significantly.
So we went from last year the, the
the model only had two seasons
worth of data, right, 2021 and 2022.
And our dry matter marks
were above one and everything was kind of
sitting above one for bricks as well.
and this year
when we went and updated it, our,
our masses are now 0.8
for less than 0.8 for dry matter.
And we’re sitting below one
for our bricks, values, for our bricks.
Ramses. So that’s great.
The little bit of glaring, I guess, kind
of, information here that everyone
might be kind of concerned about.
Is this hue reading for the red kiwifruit?
Now, this is kind of an experimental model
that we decided to just pursue because
we were collecting the data for it.
Anyways.
but for the red hue, it’s just in, in,
in, monumentally complex fruit to measure
with a reference method,
which is a, usually a colorimeter,
because coloration is, is so variable
within the fruit itself.
With the red kiwifruit,
it’s impossible for us
to use our instrument
as a direct comparison to the Colorimeter.
The Colorimeter is a much smaller
scan window.
It’s only getting a very specific point
to the flash,
which might have a little bit of gold,
a little bit of red in it.
but when we use our device,
it’s really getting a much bigger picture.
and so that is why we’re not
we’re really not seeing much accuracy,
at all from this around 15,
which is in hue, it’s in hue angles.
So, 15 degrees of, accuracy here.
so that will, you know,
we’ll continue to explore that route.
But, as far as I know right now,
that’s not really,
something that’s really critical for,
for people that are growing red
kiwifruit to understand, quite yet
I’m sure that they’ll nail down
a process, for a reference methodology,
sometime in the near future.
And once that is, occurs,
then we will be able
to kind of build up this model a lot more,
but overall really happy
with the performance of these models.
I mean, everything
being at pretty much at or
below one for, accuracy.
as far as, the,
the rmsd values are concerned,
that’s just really
great performance overall.
Now, what are
we going to do in the future from here?
Where are we going from here?
So the, industry itself,
you know, as, as industry members
that are on this, on this webinar
right now,
you have, you know, some decisions
to make after this information
that I’ve presented to you.
this technology really lends itself
as a excellent monitoring tool
for your harvest monitoring.
You know,
it can help reduce your testing costs.
It can allow you to get better insights
so you know exactly
when you need to send fruit in to test.
To get that, go ahead to harvest,
for the post-harvest supply chain,
you know, it just allowing you to sample
at a much higher rate.
So you really are confident
in the fruit that you are receiving
that it’s, the highest possible quality.
Same with importers
and all sorts of things.
And even laboratories can help use this
as a, as a kind of,
monitoring or assessment tool and,
and their own way
to help them, kind of scale, you know,
scale their operations as well. So
what we need to do moving forward,
I’ve already mentioned
we’ve been building up
these really robust data sets.
I also told you I would mention other
regions that we do include in our model.
So we have collected data from,
some data from South Korea.
We’ve collected data from Italy.
We’ve collected data from Chilean, fruit,
Greece as well.
but, what we’re doing
now is where
we need to expand our horizons more.
And so we need to continue to collect
that data set, but from a wider range.
So, you know, France,
as a, as a major growing region as well,
that we need to collect data from.
So we’re going to continue
to pursue those leads to make sure
that these models
are continuously updated and improved,
and that they work really well
for everyone.
That being said, Regionality
and the kiwifruit,
may or may not present itself
as much of an issue with this device.
It really requires us
to have to go out there and
do some actual testing
and do some experimentation.
So, what we’ll do in the future is,
you know, continue to update these models
as we have will,
you know, from our partners,
every time we collect data,
we always will use
that to update our models
and provide these updates for free.
and then we’ll also be exploring,
like I said, those advanced,
more advanced neural network machine
learning approaches to key, metrics
to help improve this model performance.
So really, what you can be sure of
is that the quality,
the accuracy that I just showed you,
the accuracy that’s in the report,
the independent report
that I’ve, put out on our website,
you can be sure that things are only going
to continue to get better.
And in this case, in some cases,
like from last year, this year,
at the very least, remain stable,
where they are at
and things aren’t going to get worse.
And so, that’s kind of the message
that I wanted to put out,
is that we’re at this level
where we’re getting really great accuracy.
Now for the kiwi fruit.
This is a technology
that’s very mature at this point.
It’s now four years in the making.
We’re in our fifth year
of data collection.
We have data that we’re collecting right
now actively, for the red kiwi fruit.
and we’re also doing some more testing.
So, really,
this product is gone from something
that was, you know, just an idea.
It’s now this very, very mature product
that is ready to be used
and all sorts of different applications.
And so if you have questions
about whether or not this
how this will fit into your operation,
you know, if you have your own quality
management system or your own farm,
management system, that you want this data
to be automatically integrated into,
we can do things like that.
We have all sorts of options for, for,
anyone that’s
really going to be handling kiwi fruit
at any point in the supply chain.
So, we’re really excited to continue
to see this, this technology grow.
And we’re putting every effort into
make sure you’re making sure that it works
for everyone as best as it possibly can.
And we’re really committed to that
that mission.
So really excited about this.
We’re happy to be, you know,
releasing this this will be available
to download this, app.
If you already own a device,
you can download the app and just
replace the old app on your device
or put it,
you know, just put the new app on
and delete the old app.
and if you are interested in purchasing a
kiwi fruit
meter,
or if you’re just interested in pricing,
any new shipments of these will all have
this brand new model on them.
and so you can be rest assured
that everything will have the latest
and greatest on it
when it get shipped out.
But Hunter will post this,
link on the chat.
And if you want to just get pricing
or if you want to just, you know,
get some questions answered, offline,
then feel free to click that link
and fill out some information,
and then we’ll get in touch with you
and help,
make sure that we can properly inform you
on on how this technology can be utilized
in your specific application.
otherwise, you know, we have a lot of
other exciting things, coming soon.
on the note of farm management systems,
we do have an upcoming, release for
a, big update to our fruit maps platform,
which is a orchard management system.
it’s a software online application
that you can use to track
all of your harvest information.
And so that will be coming soon.
So please follow us on our social media
or just check out our website,
sign up for our newsletter.
Our we have great newsletters,
a lot of really interesting,
publications
that we, we to discuss in our newsletters.
you can do that through our website.
and yeah,
thank you all so much for joining today.
I’m going to go ahead and open up
the Q&A and answer any questions you have.
And, Hunter, if you could, if you want to
just throw my email up in the chat,
so, people have access to be able
to email me if they want, questions,
if they think of them after the,
the session today, then
I’m happy to answer those.
the first
question is, oh, this is a great question.
And I’m glad this is this was asked,
does the d750 need to be updated?
the firmware does the firmware need
to be updated to use the new Kiwi models?
So this app is using the same firmware
that we’ve been using, for a while now.
So there should be no firmware
update needed if you are on the latest
firmware already
that is available on our website.
if you have already updated your unit,
then then there will be no other
further updates
needed. It’s just as simple.
Copy and paste the new app file
onto your SD
card of your device.
The next question,
what are the prediction ranges?
The minimum and to maximum values
for, the, dry matter
and soluble solids I’m
guessing has what that the DZ and the SS.
so, for dry
matter, it depends on which variety
we’re looking at.
but typically we’re looking at anywhere
from like ten
to mid 20s for dry matter.
for brix actually much low.
We much lower,
so probably around 3 to 4 up to,
the 20s, up to,
you know, up to like low 20s for Brix.
and that is dependent on which variety.
But, most of them
have approximately that range,
but you’ll be able to see from the,
the independent validation report
that I, that I put up on the website.
you’ll be able to see from that
on those graphs, the ranges, because
the validation sets we use encompass
the entire range of, possible prediction.
So, and that, that range
that’s covered is the minimum and maximum
values of that range.
So that was a great question.
Thank you both.
Those are really good questions.
Appreciate it.
So if we don’t have any other questions
we can go ahead and wrap up.
I just want to thank everyone again.
We have one more here.
did you include pre harvest readings
and how long in storage
did you follow the fruit.
So pre harvest readings.
Yes. That was really the initial
kind of goal
of this technology was only to be used
in this pre harvest application.
But then we kind of expanded it
into a more post harvest stuff as well.
So everything we’ve done for data
collection has been included
from early early season pre harvest
like all the way through
basically to the post harvest stage.
Now in post harvest, that’s kind of where
it gets a little more a little messier.
We’ve done studies
where we’re putting things in cold store
and we’re taking things out and taking,
you know, at different temperatures,
basically to help, you know, and build
that temperature variability
into the models.
We’ve also, done a lot of, post harvest,
retail actual like retail outlets testing
where we’re going out and from retail
outlets, we’re picking fruit and we’re
testing it in our laboratory and house.
so we’ve really kind of
got everything up through that,
you know, everything from the early stage
all the way through to the very end
consumer end
point, in that, in that, range.
All right.
So if there are no other questions, then
we’ll go ahead and and today’s webinar.
But like I said, if you have any
if you think of any other questions
please feel free to reach out to us.
you can reach out to me directly
if you would like.
and I’m happy to answer any questions
that you might have.
also, if you are interested
in the modeling stuff,
all the modeling things that I talked
about, we do have a really comprehensive
webinar series on our YouTube page
that covers all the basics
that you need to know about how modeling
is conducted with Nar spectroscopy,
all the considerations you have to make,
and everything, very comprehensive
and, very useful to help learn about this
technology and how it works. So.
All right, well, that being said,
thank you, everybody, and,
have a great rest of your day.
Related Products
Most Popular Articles
- Spectrophotometry in 2023
- NIR Applications in Agriculture – Everything…
- The Importance of Food Quality Testing
- The 5 Most Important Parameters in Produce Quality Control
- Melon Fruit: Quality, Production & Physiology
- Fruit Respiration Impact on Fruit Quality
- Guide to Fresh Fruit Quality Control
- Liquid Spectrophotometry & Food Industry Applications
- Ethylene (C2H4) – Ripening, Crops & Agriculture
- Understanding Chemometrics for NIR Spectroscopy